Journals
Antineoplastic activity of cucurbitacin I in CC531 rat colorectal cancer cells
A B S T R A C T
Purpose: The triterpenoid Cucurbitacin I (Cu I; isolated from Iberis amara), which is a natural inhibitor of JAK/STAT3 was examined for its antineoplastic effect in CC531 rat colon cancer cells in vitro and in vivo.
Methods: Initially, the antiproliferative effect of Cu I was studied by MTT assay and anti-migratory effects by wound healing assay. Then, a colony assay was used to determine the inhibition of colony formation in response to Cu I. Cell cycle changes were analyzed by propidium iodide staining and apoptosis induction was evaluated by annexin V staining, using flow cytometry, respectively. Hoechst 33342 staining was utilized to detect changes in nuclear morphology. Detection of Stat3 and pStat3 proteins was done by Western blot. The orthotopic CC531 model for colorectal cancer liver metastasis was instrumental for assessing the antitumor effect of Cu I in vivo.
Results: Our results show that Cu I can inhibit the proliferation and migration of CC531 cells in a dose- and time-dependent manner. Colony formation was completely suppressed at concentrations corresponding to one third of the IC50. Furthermore, exposure to Cu I resulted in accumulation of G1/M phase- and apoptotic cells in vitro. Stat3 was detected in CC531 cells growing in vitro, but pStat3 was noticed only in vivo. Treatment with maximum tolerated doses of Cu I (200 - 300 µg/kg) did not result into significant inhibition of colorectal liver metastases in vivo.
Conclusions: These findings demonstrate that the measurable antineoplastic activity of Cu I does not depend on the presence of pStat3.
K E Y W O R D S
Cucurbitacin I, Stat3, pStat3, CC531 rat colorectal cancer cells, liver metastasis model.
I N T R O D U C T I O N
Colorectal cancer (CRC) is the third most common cancer throughout the world and constitutes one of the major causes of cancer related death in Western countries [1, 2]. Colorectal cancer incidence rates have been increasing worldwide, especially in countries with high-income economy and the reason for this increase is thought in changing nutritional behavior and physical activity [3]. Early-stage colorectal cancer can often be cured by surgical resection but for patients with advanced colorectal cancer, the administration of antineoplastic chemotherapy is vital. Hitherto developed anti-cancer agents, including molecular-targeted drugs, contribute to an improved outcome of colorectal cancer treatment, but the results are still insufficient as no cures of metastatic cancers can be obtained [4]. Reasons for this failure include development of drug resistance as well as cumulative host toxicity, which are prone to dose reduction or discontinuation of treatment. For these reasons, current research attempts to discover and develop anticancer drugs with a new mechanism of action and low toxicity for oncologic treatment [5, 6].
Cucurbitacins are a class of highly oxidized tetracyclic triterpenoids, which can be grouped into twelve categories. Naturally or semi-synthetically occurring cucurbitacins have anticancer activity [7]. One of them, cucurbitacin I, is most widely used for in vitro and in vivo tumor treatment studies [8]. A number of molecular targets have been discovered for cucurbitacins, such as signal transducer and activator of transcription 3 (STAT3), fibrous-actin, cyclooxygenase-2, and others [8]. Like further cucurbitacins, cucurbitacin-I acts as a potent inhibitor of the Janus kinase (JAK)/STAT3 signaling pathway, which is suggested in colon cancer to be important for the tumorigenic ability of cancer stem cells [9]. Yet, the anticancer effect of cucurbitacin-I and the underlying mechanism in colon cancer cells remain still unclear. The aim of this study was to examine the role of cucurbitacin-I in CC531 rat colorectal cancer cells, which serve as a valuable model in experimental antineoplastic chemotherapy [5].
Materials and methods
Chemicals
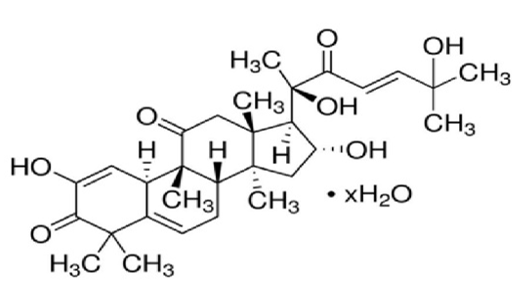
Figure 1: Chemical structure of Cucurbitacin I; alternative designations are 2,16α,20,25-tetrahydroxy-9-methyl-19-Nor-9β,10α-lanosta-1,5,23-triene-3,11,22-trione; Elatericin B; JSI-124; NSC 521777. The molecular weight corresponds to 514.65 Da.
Cell line and culture conditions
CC531lacZ rat colorectal cancer cells were maintained in monolayer culture in RPMI-1640 medium (Invitrogen, Karlsruhe, Germany) supplemented with 10% heat inactivated fetal bovine serum (FBS) (Biowest, France), 1% glutamine (Invitrogen, Karlsruhe, Germany) and 1% Penicillin/Streptomycin (Invitrogen, Karlsruhe, Germany) at 37° in a 5% CO2 humidified atmosphere. The cells were passaged every 4th day with 0.25% trypsin to maintain logarithmic growth.
In vitro cell proliferation assay
Cell proliferation was assessed by the MTT (3-[4,5-dimethylthiazol-2-yl]-2,5-diphenyltetrazolium bromide) colorimetric assay, as described by Kaleağasıoğlu, with some modifications [9]. In brief, 4000 CC531 cells were seeded per well of 96 well plate and incubated for 24 h. Then treatment (see below) was added and cells were exposed for 24, 48, or 72 h. Following these exposure periods, the surviving CC531 cells were measured by the MTT (3-(4,5-dimethylthiazol-2-yl)-2, 5-diphenyltetrazolium bromide) method. MTT (Serva, Germany) solution (5 mg/ml in PBS) was added (10 μl/well). Plates were further incubated for 3 h, and thereafter the medium was discarded. The cells were lysed, and formazan crystals were dissolved by the addi¬tion of 110 μl solvent (0.04 N HCl acid in 2-propanol) per well followed by thorough mixing. Optical density was measured at 540-nm wavelength (690 nm reference wavelength) using a BioTek ELISA plate reader.
Clonogenic assay
This assay is an in vitro cell survival and proliferation assay based on the ability of a single cell to grow into a colony (10;11) Briefly, 500 cells were mixed gently and plated on a 6-well plate. After being incubated for 24 hours, the cells were exposed to control and low cucurbitacin I concentrations, ranging from 30 to-60 nM. Treatment was repeated every 5 days by exchanging the old medium, and about 2 weeks later, the colony forming cells were washed with phosphate-buffered saline and stained with crystal violet. Colonies with a diameter of more than 50 cells were counted. The experiment was repeated three times.
In vitro wound healing (scratch) assay
Cu I treated cells were plated in 24-well plates for 24 h, then respective cell areas of each well were wounded by scratching with a 200-µl sterile plastic pipette tip as described by Kaleağasıoğlu [6]. The cells were rinsed with culture medium to remove debris and then treated with different concentrations (0, 4, 20, 100 and 500 nM) of cucurbitacin-I. Following 0, 12 and 24 h, the scratched areas were photographed with an Axio Observer.Z1 microscope (Carl Zeiss AG, Oberkochen, Germany) and the remaining size of the ‘wound’ was measured.
Flow cytometric analysis of cell cycle
Cell cycle analysis was performed using the standard propidium iodide (PI) method, which is a nucleic acid intercalator. Briefly, cells were trypsinized, centrifuged (1200 rpm), washed with ice-cold PBS, and fixed in 70 % ethanol at 4 °C overnight. Then the samples were incubated in the dark for 30 minutes at 37°C with 50 µg/mL RNase. Finally, for cellular DNA staining, PI solution was added (50 µg/mL) and after 5-10 minutes of incubation FACS analysis was started. Ten thousand cells (events) per sample were analyzed to study the distribution of the cells in G0/G1, S and G2/M phases of the cell cycle and relative percentages were deter¬mined by Modfit LT software.
Annexin V-FITC binding assay
Apoptotic response of the cells to Cu I treatment was investigated by annexin V-FITC apoptosis detection kit (eBioscience, Frankfurt, Germany). In brief, the cells were treated with Cu I (0, 4, 20, 100 and 500 nM) for 48 h and harvested with EDTA free trypsin. After two washing steps (PBS and 1X binding buffer), the cells (2×10⁵) were re-suspended in 100 µl of 1X binding buffer (provided by the kit) and 5 µl of fluorochrome-conjugated annexin V-FITC was added, followed by 15 min incubation at room temperature in dark. Cells were washed with 1X binding buffer to remove additional unbound annexin V-FITC and re-suspended in 200 µl of 1X binding buffer. PI (5 µl) was added to each sample and analyses were done with a FACS Calibur flow cytometer (BD Biosciences, San Jose, CA, USA).
Hoechst Staining
In order to examine nuclear morphological changes of the cells after Cu-I treatment, Hoechst 33342 staining was performed. The dye Hoechst 33342 was diluted (1:100) with distilled water. After treatment with the indicated concentration of Cu-I, cells were stained by 10 µM Hoechst 33342 for 10 minutes at room temperature. Then, the dye was discarded, and the stained cells were rinsed three times with PBS, spun on glass slides and systematically photographed at random areas with an Axiophot microscope (Carl Zeiss, Oberkochen, Germany).
Western blot analysis
CC531 cells (3×10⁵ cells/flask) were treated in 25 cm2 cell culture flasks with Cu I (0, 4, 20, 100 and 500 nM) for 48 h. After the treatment, cells were harvested, transferred to 1.5-ml micro-centrifuge tubes, washed in PBS and pellets were lysed with RIPA buffer (150 mM sodium chloride, 1.0% NP-40, 0.5% sodium deoxycholate, 0.1% sodium dodecyl sulphate, 50 mM Tris, pH 8.0) supplemented with complete protease inhibitor cocktail tablets (PhosphoStop, Roche, Mannheim, Germany). The lysates were maintained at constant agitation for 30 minutes at 4°C and later the supernatant was collected after spinning at 14,000 rpm at 4°C for 20 min. The supernatant was quantified for protein concentration using the Pierce Protein Assay. The total protein lysates (30–50 µg) were subjected to electrophoresis on 4-12% gradient polyacrylamide SDS gels. Proteins were transferred onto PVDF membranes and the membranes were probed for different proteins (Stat3 and pStat3) using specific antibodies (Cell Signaling Technologies, Frankfurt, Germany) as per manufacturer’s instructions. Immunoblots were developed using an HRP-conjugated anti-mouse or anti-rabbit IgG (Cell Signaling Technologies, Frankfurt, Germany) and ECL-System (Amersham Pharmacia Biotech, Munich, Germany). Levels of β-actin / GAPDH were used to normalize the protein expression. Relative concentrations were assessed by densitometric analysis of digitized autographic images using the ImageJ Program.
Animals and husbandry
Wag RIJ rats were obtained from Charles River (Charles River, Sulzfeld, Germany) at an age of 6-8 weeks and a corresponding body weight of 130-180 g. They were housed under SPF conditions in the central animal facility of the DKFZ. The rats had free access to autoclaved food and water and were maintained under controlled conditions (21±2 °C room temperature 55% humidity and a 12 h light-dark rhythm).
Tumor cell transplantation
CC531 rat colorectal adenocarcinoma cells were trypsinized and a specified number (4×10⁶ cells) was suspended in 0.25 ml PBS and 0.15 ml Matrigel (Biomatrix EHS solution, Serva Electrophoresis GmbH). This suspension was stored on ice until further use. For injection of tumor cell suspension, the rats were anaesthetized (isoflurane at 1.5 Vol% in 0.5 l/min oxygen and 1 l/min nitrous oxide). After a vertical midline incision, the caecum was exteriorized onto a compress moistened with sterile physiological saline and a mesocolic vein was isolated from mesenteric fat. The tumor cell suspension was injected into this vein with a 301/2-gauge needle. After hemostasis, the caecum was moved back into the abdomen; the musculature was sutured (3-0 vicryl, Ethicon GmbH, Norderstedt, Germany) and the skin closed with metal clips.
Intraperitoneal (IP) injection
For therapy, drugs were diluted in ethanol appropriate concentration and injected into the peritoneal cavity (ip). As indicated in (Table 1), Cu I was injected i.p. every second day to achieve a therapeutic concentration for an extended period of time.
Evaluation of treatment
After the experimental period, all rats were euthanized and necropsied. Specifically, the liver of animals was excised and weighed. The median volume of each group was used for comparison.
Statistics
The data were expressed as mean values ± SD. The cell proliferation was analyzed by GraphPad Prism 6 Software. The raw data were normalized and used for a nonlinear fit. From this fit, IC50 values and 95% confidence limits were derived. Statistical differences in wound healing were calculated by one-way, single factor ANOVA analysis and post hoc Dunnett T3 test. P-values ≤0.05 were considered to indicate statistically significant results.
Results
Effect of Cu I on CC531 cell viability
Figure 2 shows the antiproliferative effect of Cu I on CC531 cells, which were exposed to increasing concentrations of Cu I (0, 4, 20, 100 and 500 nM). A concentration-dependent inhibition of CC531 cells was observed in the dose range from 100 to 500 nM Cu I. After 48h of exposure, the Cu I concentration inhibiting 50% of cell growth (IC50) was 90.3 nM (95% confidence limits: 88.7 – 121.6 nM). After 72 h, there was no significant change (IC50: 92.8 nM, 95% confidence limits: 85.7 – 139.6 nM).
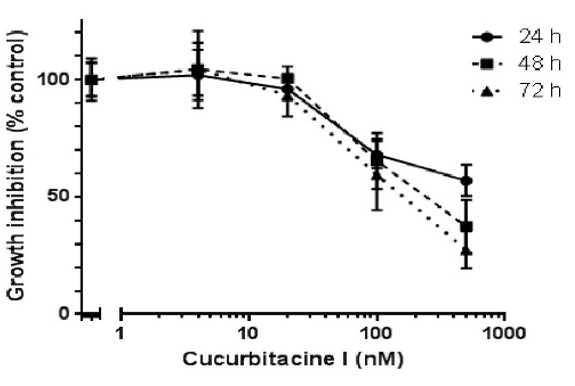
Figure 2: Inhibition of CC531 cell proliferation in response to cucurbitacin I at the indicated concentrations (0, 4, 20, 100, and 500 nM) for 24, 48, and 72 h. The IC50 values were derived from three independent experiments (48 h: 90.3 nM; 95% confidence limits: 88.7 – 121.6; 72 h: 92.8 nM; 95% confidence limits: 85.7 – 139.6).
Effect of Cu I on CC531 colony formation
The inhibition of CC531 colony formation is shown in (Figure 3). The clonogenic assay is an in vitro cell survival assay that is based on the ability of a single cell to grow into a colony in 2 weeks. Cucurbitacin-I was administered at concentrations of 30nM and 60 nM and this treatment, which was repeated after 5 days, inhibited the growth of colonies completely, as compared to control (p < 0.001).
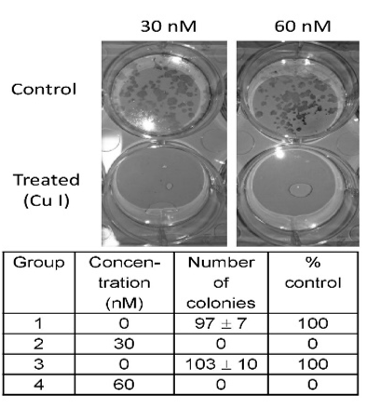
Figure 3: Clonogenicity of CC531 cells in response to cucurbitacin I. Top: digital image showing CC531 colonies at 2 weeks after seeding 500 cells per well into a 6well plate. Exposure to cucurbitacin I (30 and 60 nM, repeated every 5 days) completely inhibited colony formation compared to control (p < 0.001). Bottom: The table gives the colony counts, standard deviation and percent control values for the four groups, respectively.
Effect of Cu I on CC531 migration (scratch assay)
To determine whether Cucurbitacin-I affects the migration of CC531 cells, a wound healing assay was performed (Figure 4). The wound healing ability of cells reflects their movement and migration on the surface on which they are anchored to. In this experiment, the changes after 12 h and 24 h of incubation were compared with the scratch size at the start of the experiment. The control group filled up the gap rapidly, within 24h. Correspondingly, the distance between the wound edges decreased progressively. For cells treated with 4 and 20 nM Cu I, there was no significant difference to the migration of controls. In the groups treated with 100 and 500 nM Cu I, there was a significant inhibition of wound closure (at 12h; p=0.003, p < 0.001 and at 24 h, p < 0.001 respectively) and the cell density was seriously decreased.
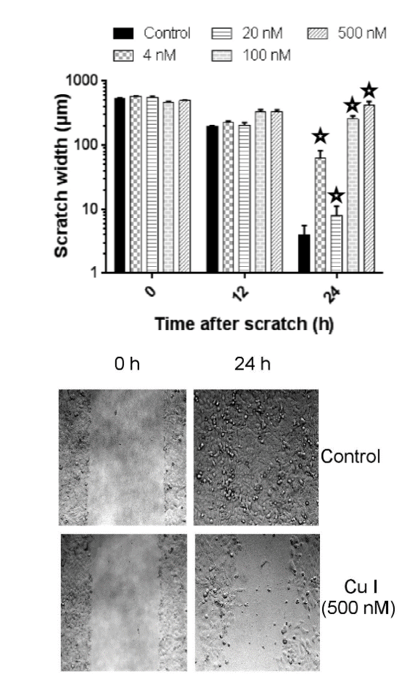
Figure 4: Scratch assay results of CC531 cells after cucurbitacin I exposure. Top: CC531 cells growing in wells of 12well plates were exposed to cucurbitacin I (4, 20, 100, 500 nM) and photographed after 0, 12 and 24 h by an Axio Observer Z1 microscope. All cucurbitacin I concentrations (4, 20, 100, 500 nM) significantly delayed ‘wound healing’ of CC531 cells at 24 h when compared to the untreated control (P< 0.002).
The effect of Cucurbitacin-I on cells cycle distribution
To explore the mechanisms underlying the Cucurbitacin-I mediated growth inhibition and analyze cell-cycle distribution we performed cell-cycle analysis of CC531 cells by flow cytometry. CC531 cells were treated with different concentrations of Cu I and the cell cycle distribution was determined after staining of the DNA with propidium iodide (PI). Following 48 h of Cu I treatment, the ratio of cells being in G1 and G2 phases was decreased (G1: at the highest concentration only), while the percentage of S phase cells was dose-dependently increased compared to the control. These results suggested that Cu I blocked CC531 cells in the S phase (Figure 5).
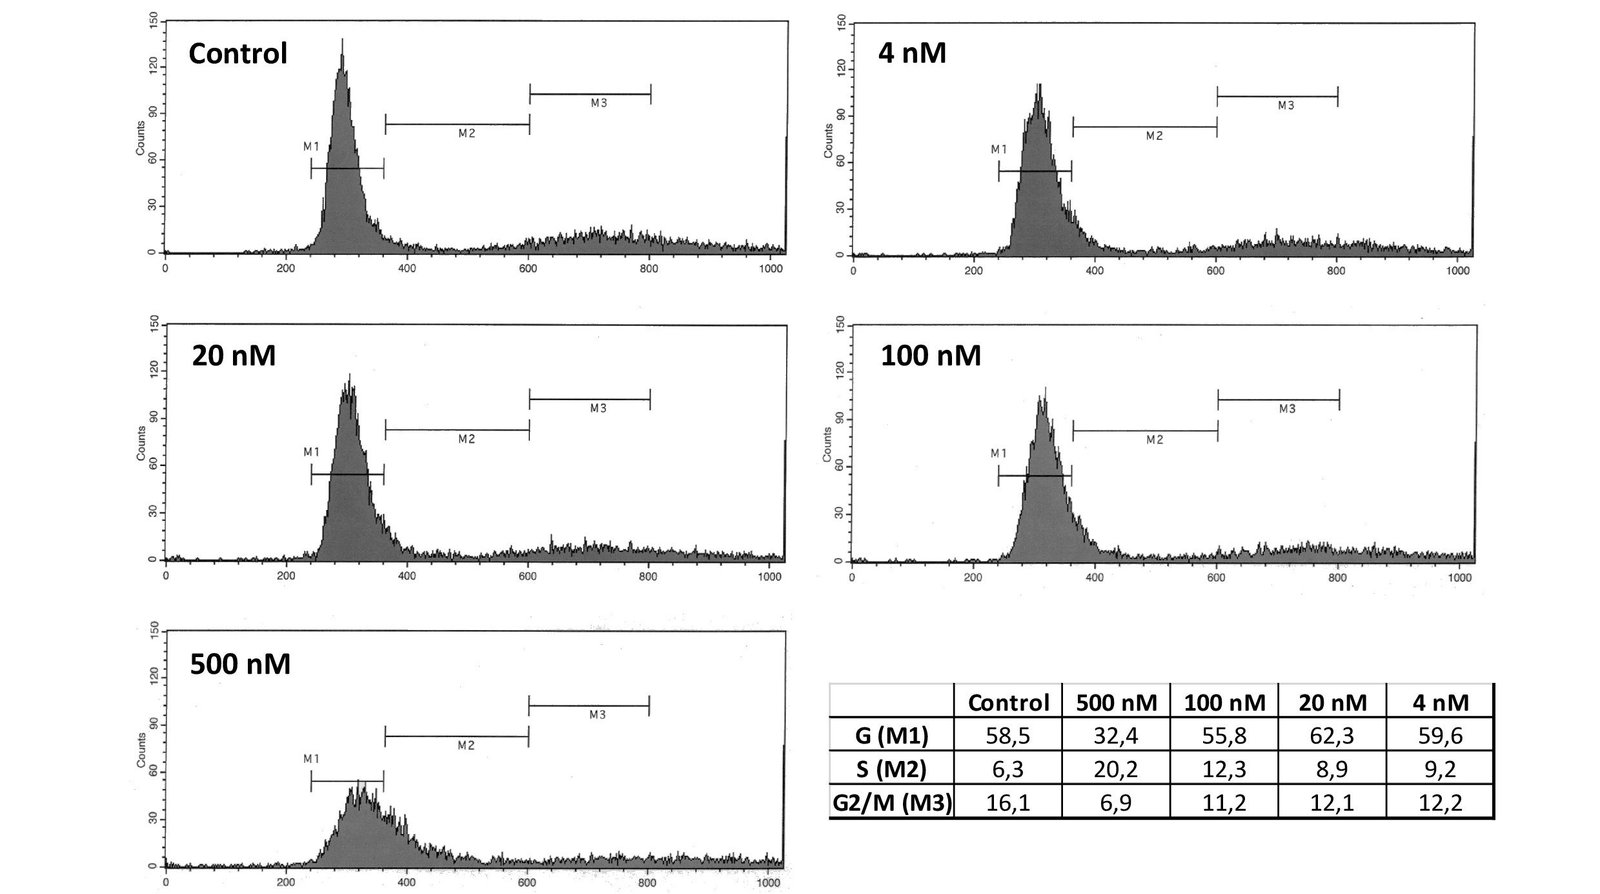
Figure 5: CC531 cells were treated with cucurbitacin I (4, 20, 100, 500 nM) for 48 h. Cells were stained with propidium iodide and analyzed by FACS. Following 48 h of cucurbitacin I treatment, the ratio of cells being in G1 and G2 phases was decreased, while the percentage of S phase cells was dose-dependently increased compared to the control. These results suggest that cucurbitacin I blocked CC531 cells in the S phase.
Apoptosis induction by Cu I
For analysis of apoptosis induction, CC531 cells were stained with annexin V at 48 h after exposing them to various concentrations of Cu I. FACS analysis showed a growing number of annexin V positive cells with increasing concentration of Cu I. The results, which are shown in (Figure 6), indicate a spontaneous apoptosis rate figuring at 10%, but Cu I exposure increased this percentage concentration-dependently to 50 % (100 nM) and 56 % (500 nM).
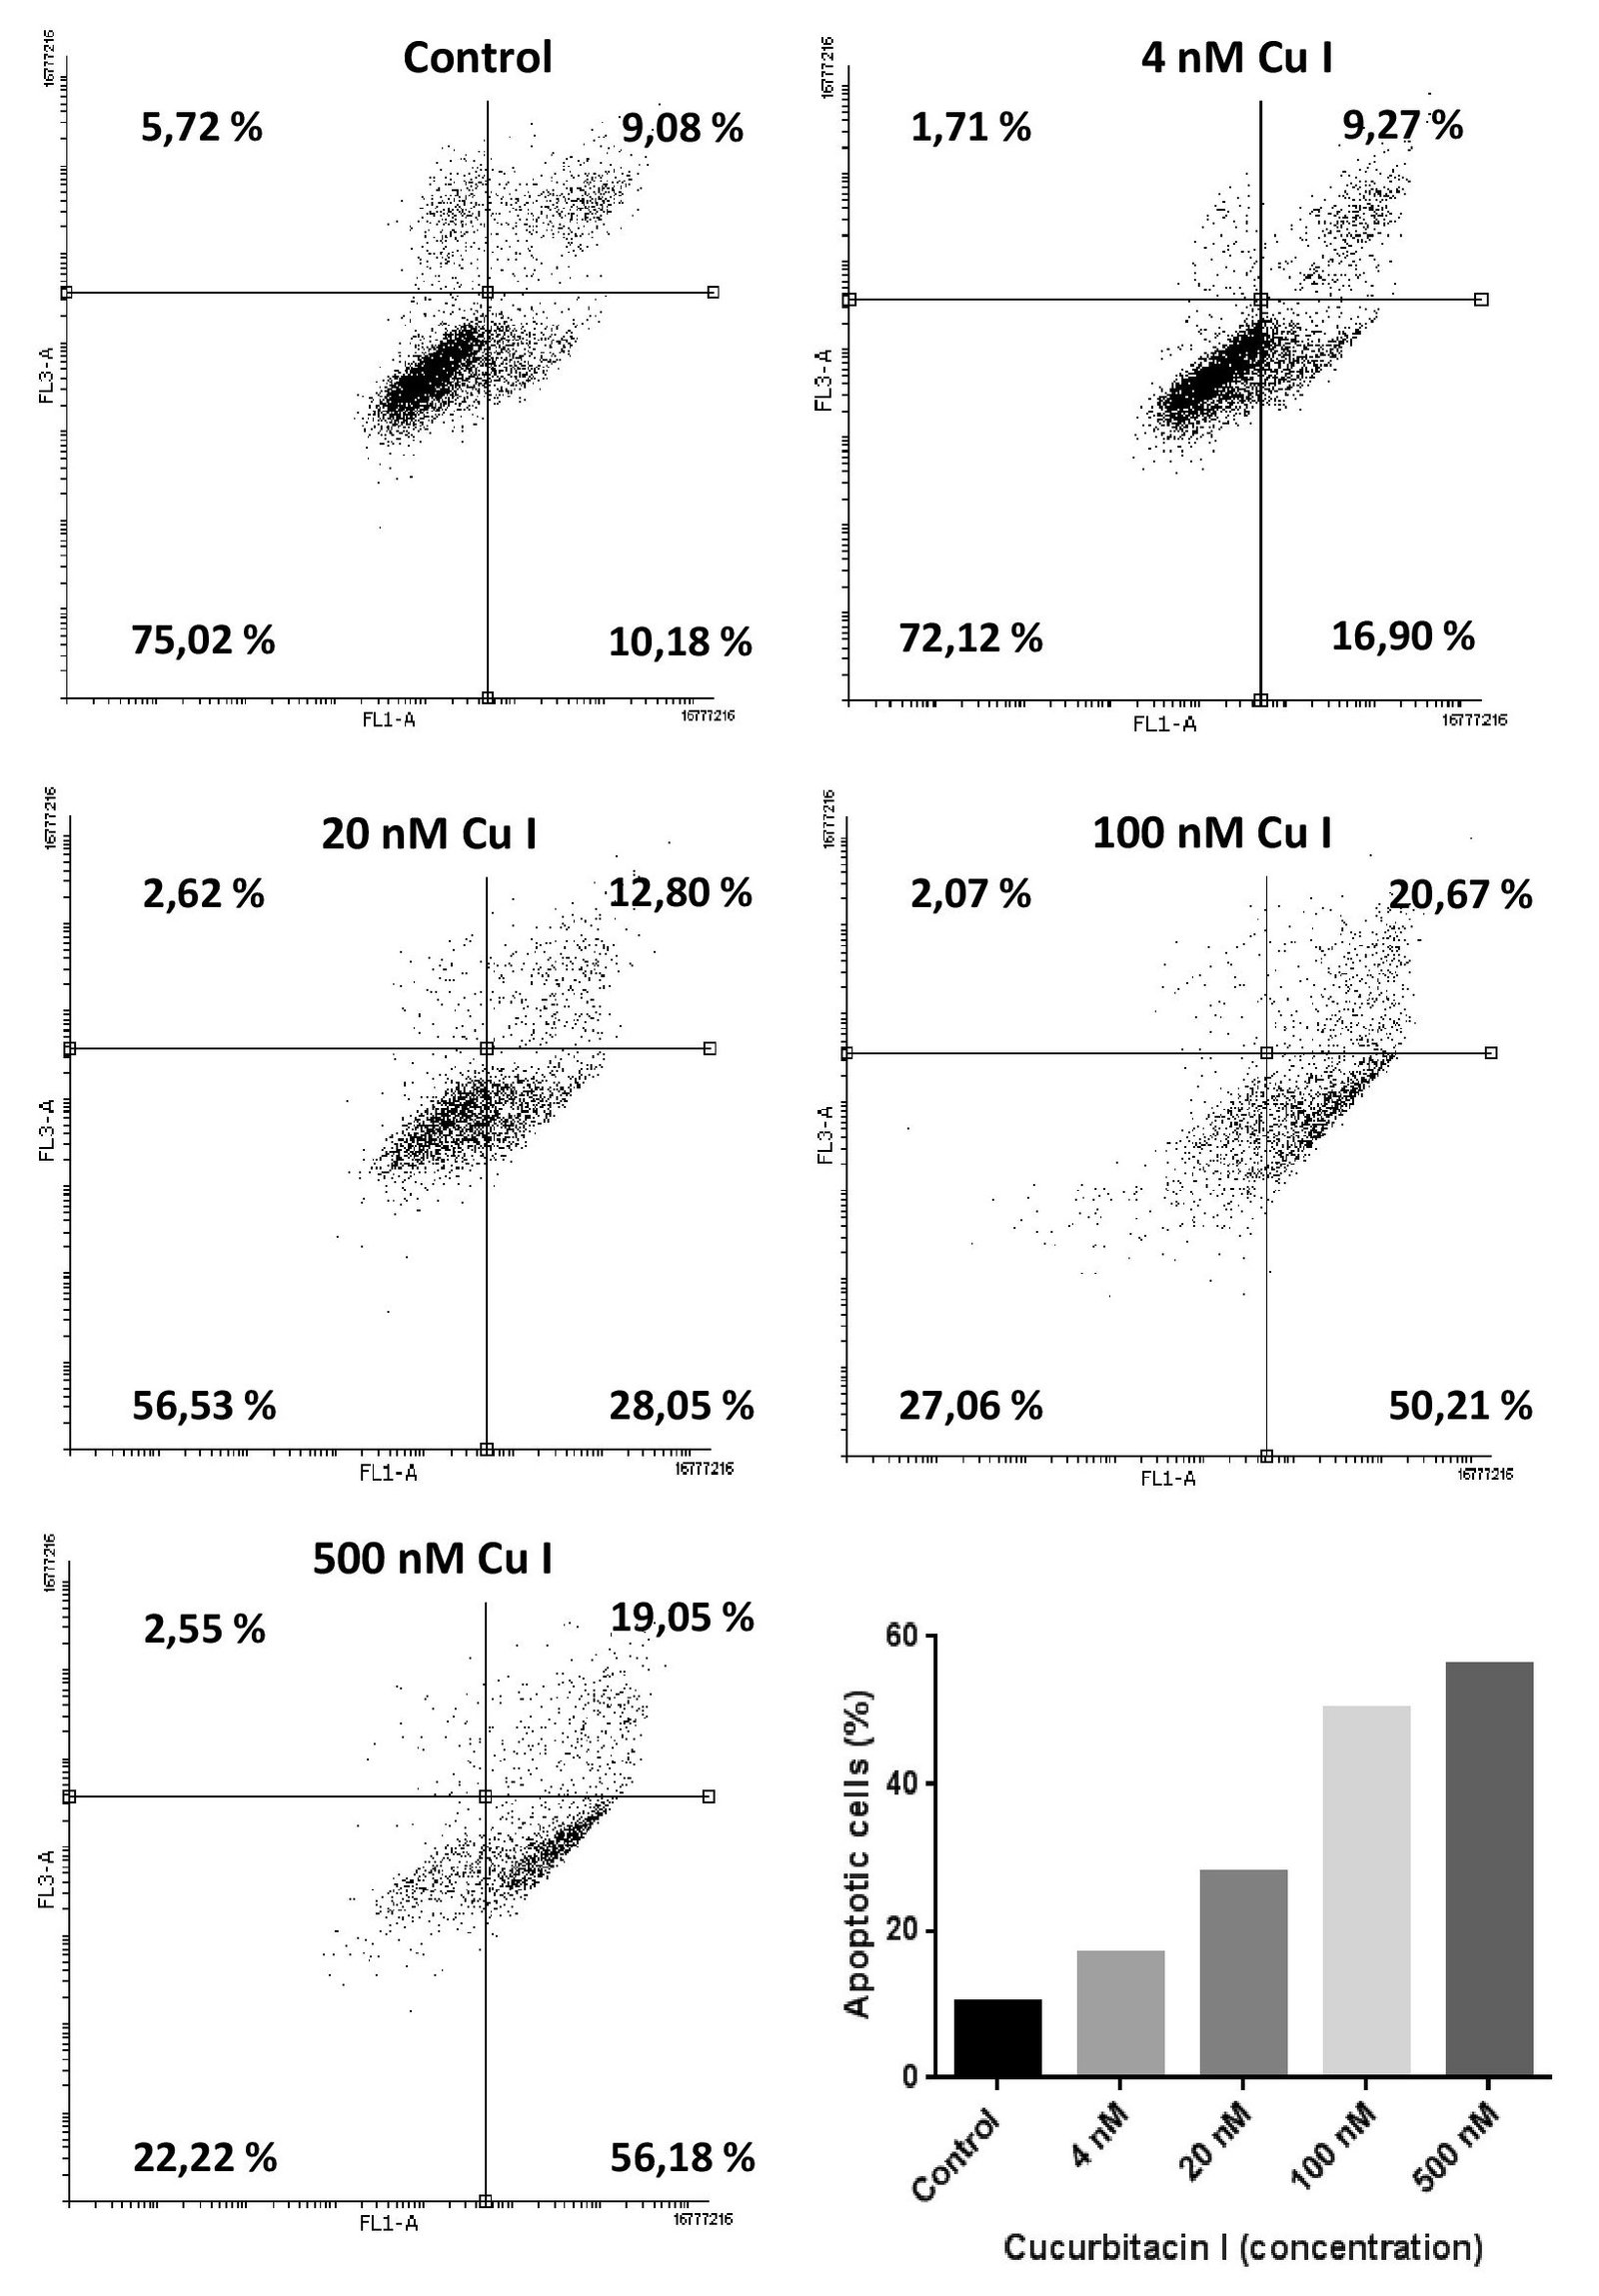
Figure 6: Flow cytometry of CC531 cells treated with cucurbitacin I (4, 20, 100, 500 nM) and stained with annexin V after 48 h. The results show that the apoptotic rate increased from 6 % (controls) to 54% (500 nM).
Apoptosis Assessment by Hoechst 33342 Staining
Hoechst 33342 was used to stain nuclear DNA. Stained nuclei appeared in light blue color under the fluorescence microscope, and the apoptotic cells showed nuclei with typical morphologic characteristics including condensation of chromatin and karyorrhexis / karyolysis. However, the nuclei of dead cells were not stained. Increasing concentrations of Cu I caused increasing changes in the nuclear morphology of CC531 cells (Figure 7).
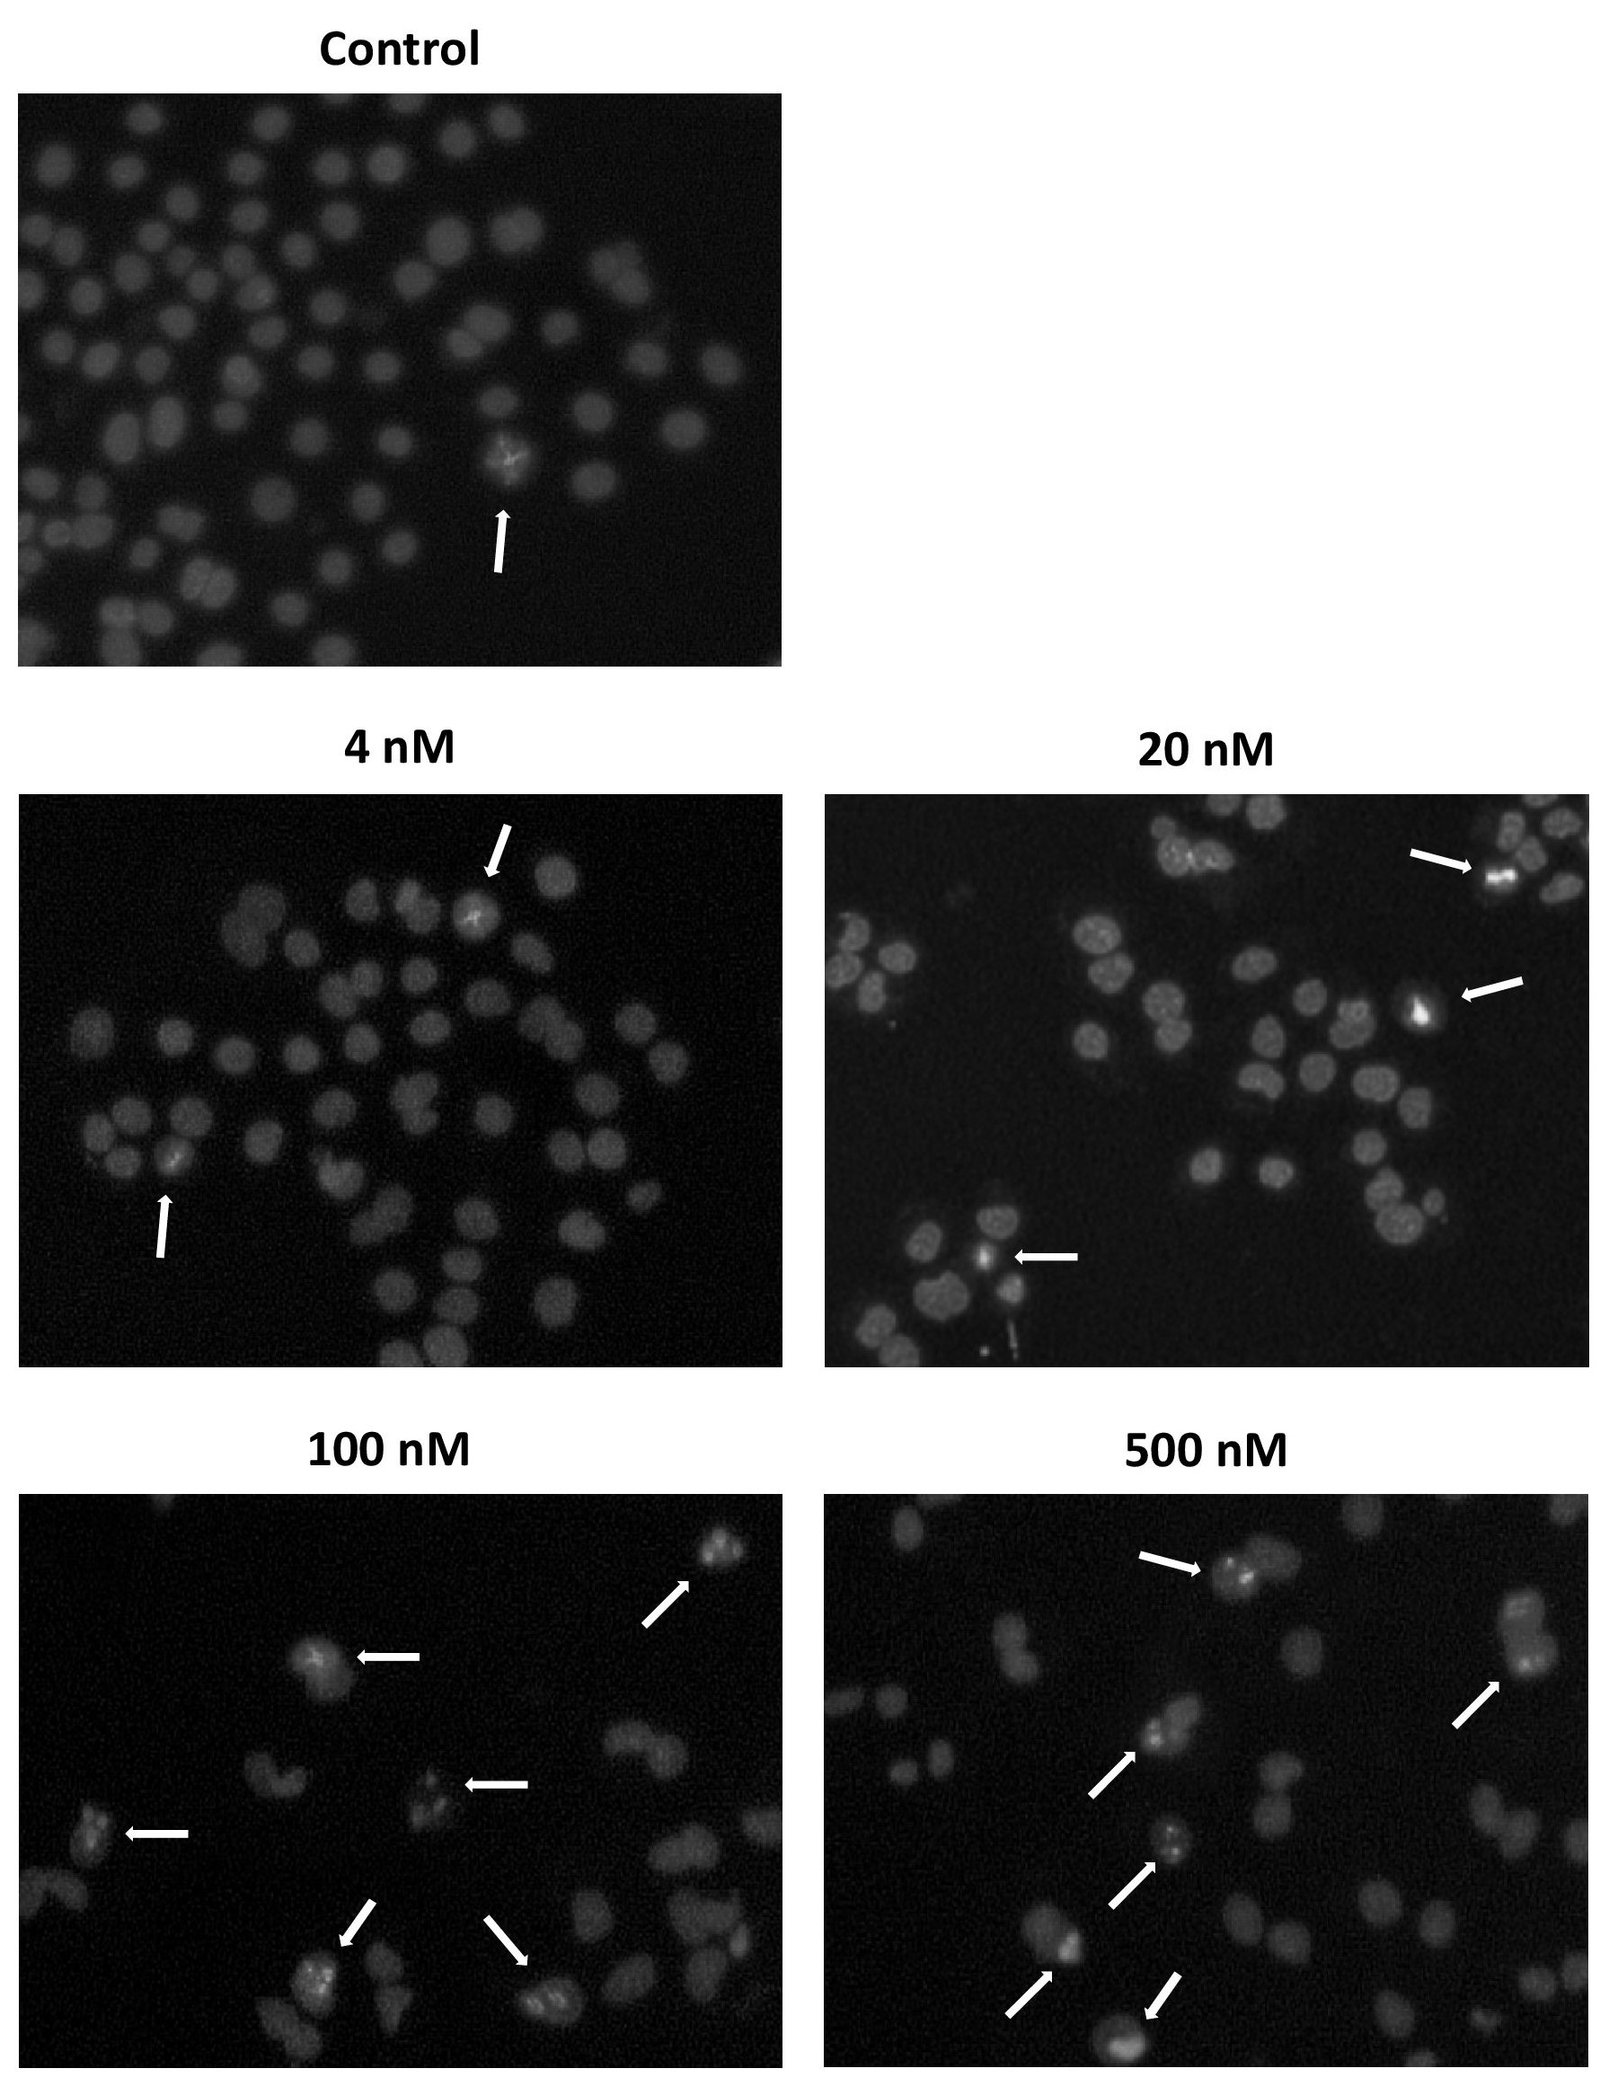
Figure 7: Hoechst 33342 staining of CC531 cells exposed to cucurbitacin I in comparison to controls. Apoptotic change was examined by fluorescence microscopy and photographed. Apoptotic cells are indicated by white arrows.
Western Blotting
The signal transducer and activator of transcription 3 (STAT3) was clearly present in CC531 cells, even more distinct than in HeLa positive control lysate provided by the kit. However, exposure to Cu I did not change the expression of this transcription factor. STAT3 expression and that of pSTAT3 were investigated because Cu I was predicted to lower the phosphorylation of STAT3. However, even lysates of CC531 control cells did not show discernible levels of pSTAT3. Consequently, in vitro exposure to Cu I did not show any effect on pSTAT3 levels (Figure 8). However, a lysate CC531 cells growing in vivo as solid tumor showed a strong band of pSTAT3, indicating that phosphorylation of STAT3 had happened in CC531 cells growing in rat liver.
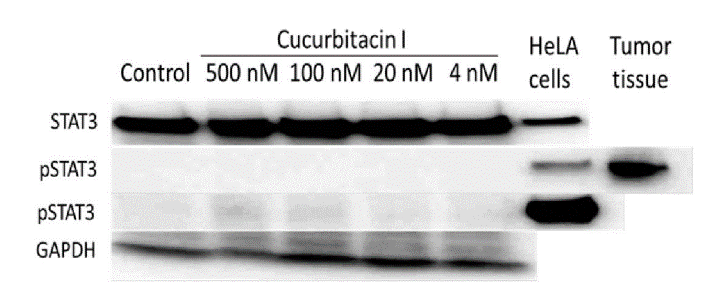
Figure 8: Western blot of CC531 cell lysates in comparison to HeLa cells and CC531 tumor tissue. STAT3 and phosphorylated STAT3 were detected and GAPDH was used as protein loading control. There was no change in Stat3 protein concentration, but in CC531 tumor tissue there was a significant increase in pStat3 concentration.
Liver metastasis experiment
The design of the liver metastasis experiment is shown in Table 1. Rats implanted intraportally with CC531 colorectal carcinoma cells and kept as positive control were followed for four weeks. These rats did not show any signs of toxicity, but 30% of the animals died of tumor-related progression before the end of the experimental period. In addition, two groups of rats were treated with 200 or 300 µg/kg Cu I every second day, starting on day 7 until day 26 after tumor implantation. In these groups, there was a 40% mortality caused by the toxicity of CuI. After four weeks all rats were sacrificed, and their liver weights recorded. The tumor weight, i.e. the total liver weight minus the normal liver weight of matching rats without tumor cell implantation is shown in (Figure 9). Clearly, the treated animals showed a somewhat reduced tumor weight, but the differences in median tumor weight were not significant.
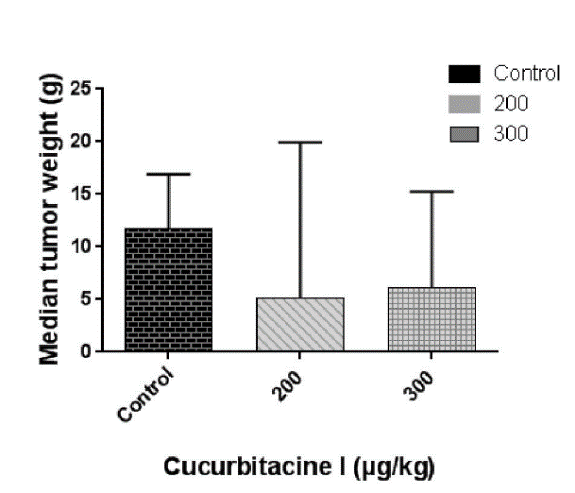
Figure 9: Mean tumor weight of rats harboring CC531 liver metastases and treated with cucurbitacin I (200 and 300 µg/kg) versus that of untreated controls.
Discussion
The members of the signal transducers and activators of transcription (STAT) family are involved in many signaling and transcription processes. They are a family of cytoplasmic transcription factors, which play important roles in cell survival, proliferation, apoptosis, differentiation, and angiogenesis in response to growth factor, cytokine, and hormone signaling. STATs are activated by tyrosine phosphorylation, which normally is a transient and well controlled process. Nevertheless, constitutively activated STATs have been observed in a large number of hematologic and solid neoplasias. According to their specific functions, STATs can be divided into two groups. The first group is made up by STAT2, STAT4, and STAT6, which are activated by cytokines and play a part in T-cell and IFN signaling. The second group includes STAT1, STAT3, and STAT5, which are active in several tissues and participate in embryogenesis, development of the mammary gland, IFN signaling, and response to growth hormone. This latter group of STATs plays an important role in controlling cell-cycle progression and apoptosis and thus contributes to oncogenesis [10].
From this latter group, STAT3 has two important phosphorylation sites, Tyr705 and Ser727, but its activation is mostly through phosphorylation at Tyr705 [11]. While Tyr705 phosphorylation is critical for STAT3 function, serine 727 (Ser727) phosphorylation can also occur and has both, stimulating and inhibitory effects on gene transcription [12-14]. An important inhibitor of the STAT3 signaling pathway is Cucurbitacin I (JSI-124) [15]. Cucurbitacins are also known to cause changes in the organization of the actin cytoskeleton (18;19). Moreover, cucurbitacin-I has been used as folk medicine in Asia and can be found in different types of plants (20; 21; [16]. More recently, CuI was described to exert anticancer activities in glioblastoma, adenocarcinoma of the lung and breast cancer cells [17-19]. Here we report on the antineoplastic effects of Cu I isolated from the plant bitter candytuft (İberis amara), which belongs to the Cucurbitaceae family. In CC531 cells growing in vitro, there was robust expression of Stat3, but only basal expression of pStat3 (Tyr705). Nevertheless, there was a clear effect of Cu I on the growth of CC531 cells under cell culture conditions.
The dose range investigated for anti-proliferative activity (4 – 500 nM) allowed calculating an IC50 value, ranging around 90 nM, but complete inhibition of CC531 growth was not observed. This contrasted with the effect on colony formation, which was completely inhibited already at 30 nM. Migration of CC531 cells, on the other hand, was inhibited at similar concentrations as proliferation, with 100 nM being the lowest effective concentration. Our results coincide with those in human COLO205 colorectal cancer cells, which showed inhibition of cell migration and invasion in response to Cu I exposure [20]. Interestingly, the cell cycle was not altered in CC531 cells, except for the highest concentration, which reduced the ratios of cells in G1 and G2 phases, respectively, but increased that of cells in S phase. This was accompanied by massive (more than 5fold) induction of apoptosis in cells exposed to 100 and 500 nM Cu I. Concomitantly, nuclear fragmentation and karyorrhexis became apparent. In cells growing in vitro, there was no significant amount of phosphorylated Stat3 protein, a status, which did not change upon exposure to Cu I. Also, there was no change in Stat3 protein concentration. Interestingly, in CC531 cells growing in vivo, there was a significant increase in pStat3 concentration, indicating Stat3 activation. However, treating rats bearing CC531 cells in their liver with Cu I did not result in a significant anticancer effect at the dosages used. The latter observation indicates that increased levels of pStat3 do not predict an effect of treatment with Cu I. Other authors have also found activity of Cu I independent of Stat3 activation [21]. Regarding the mechanism of action, STAT3 is activated both, in tumor and in immune cells in the tumor microenvironment. Constitutively activated STAT3 inhibits the expression of mediators necessary for immune activation against tumor cells, thus leading to tumor-induced immunosuppression [22, 23]. As pStat3 was significantly increased in CC531 cells in vivo, the resulting immune suppression might have contributed to the lack of anticancer efficacy.
In conclusion, Cu I inhibited the growth and migration of CC531 cells in vitro, which, however, showed no relevant level of pStat3. This inhibition was associated with apoptosis induction. Colony formation was repressed at a Cu I concentrations being two thirds lower than the IC50. Administration of Cu I to rats harboring liver metastases did not show a significant antitumor effect, although high pStat3 levels were detected. Thus, these findings demonstrate that the measurable antineoplastic activity of Cu I does not depend on the presence of pStat3.
Conflict of interest
The authors declare no conflict of interest.
Funding
The study was supported by Tubitak (The Scientific and Technological Research Council of Turkey) project no. 112S327 (E. Eyol).
Ethical approval
This article does not contain any studies with human participants performed by any of the authors.
All applicable international, national, and/or institutional guidelines for the care and use of animals were followed.
Article Info
Article Type
Research ArticlePublication history
Received: Sat 09, Feb 2019Accepted: Fri 01, Mar 2019
Published: Mon 11, Mar 2019
Copyright
© 2023 Martin R. Berger. This is an open-access article distributed under the terms of the Creative Commons Attribution License, which permits unrestricted use, distribution, and reproduction in any medium, provided the original author and source are credited. Hosting by Science Repository.DOI: 10.31487/j.COR.2019.01.105
Author Info
Corresponding Author
Martin R. BergerChemotherapy and Toxicology Unit, German Cancer Research Center, Heidelberg, Germany
Figures & Tables
References
- Center MM, Jemal A, Ward E (2009) International trends in colorectal cancer incidence rates. Cancer Epidemiol Biomarkers Prev 18: 1688-1694. [Crossref]
- Haggar FA, Boushey RP (2009) Colorectal cancer epidemiology: incidence, mortality, survival, and risk factors. Clin Colon Rectal Surg 22: 191-197. [Crossref]
- Ait Ouakrim D, Pizot C, Boniol M, Malvezzi M, Boniol M, et al. (2015) Trends in colorectal cancer mortality in Europe: retrospective analysis of the WHO mortality database. BMJ 6: 351. [Crossref]
- Nielsen DL, Palshof JA, Larsen FO, Jensen BV, Pfeiffer P (2014) A systematic review of salvage therapy to patients with metastatic colorectal cancer previously treated with fluorouracil, oxaliplatin and irinotecan +/- targeted therapy. Cancer Treat Rev 40: 701-715. [Crossref]
- Uhlmann ME, Georges RB, Boleij A, Eyol E, Kubarenko A, et al. (2011) Influence of osteopontin expression on the metastatic growth of CC531 rat colorectal carcinoma cells in rat liver. Cancer Gene Ther 18: 795-805. [Crossref]
- Kaleagasioglu F, Berger MR (2014) Differential effects of erufosine on proliferation, wound healing and apoptosis in colorectal cancer cell lines. Oncol Rep 31: 1407-1416. [Crossref]
- Alghasham AA (2013) Cucurbitacins - a promising target for cancer therapy. Int J Health Sci (Qassim) 7: 77-89. [Crossref]
- Kim HJ, Park JH, Kim JK (2014) Cucurbitacin-I, a natural cell-permeable triterpenoid isolated from Cucurbitaceae, exerts potent anticancer effect in colon cancer. Chem Biol Interact 219: 1-8. [Crossref]
- Kroon P, Berry PA, Stower MJ, Rodrigues G, Mann VM, et al. (2013) JAK-STAT blockade inhibits tumor initiation and clonogenic recovery of prostate cancer stem-like cells. Cancer Res 73: 5288-5298. [Crossref]
- Calo V, Migliavacca M, Bazan V, Macaluso M, Buscemi M, et al. (2003) STAT proteins: from normal control of cellular events to tumorigenesis. J Cell Physiol 197: 157-168. [Crossref]
- Sakaguchi M, Oka M, Iwasaki T, Fukami Y, Nishigori C (2012) Role and regulation of STAT3 phosphorylation at Ser727 in melanocytes and melanoma cells. J Invest Dermatol 132: 1877-1885. [Crossref]
- Frank DA, Mahajan S, Ritz J (1997) B lymphocytes from patients with chronic lymphocytic leukemia contain signal transducer and activator of transcription (STAT) 1 and STAT3 constitutively phosphorylated on serine residues. J Clin Invest 100: 3140-3148. [Crossref]
- Mandal T, Bhowmik A, Chatterjee A, Chatterjee U, Chatterjee S, et al. (2014) Reduced phosphorylation of Stat3 at Ser-727 mediated by casein kinase 2 - protein phosphatase 2A enhances Stat3 Tyr-705 induced tumorigenic potential of glioma cells. Cell Signal 26: 1725-1734. [Crossref]
- Hazan-Halevy I, Harris D, Liu ZM, Liu J, Li P, et al. (2010) STAT3 is constitutively phosphorylated on serine 727 residues, binds DNA, and activates transcription in CLL cells. Blood 115: 2852-2863. [Crossref]
- Jing N, Tweardy DJ (2005) Targeting Stat3 in cancer therapy. Anticancer Drugs 16: 601-607. [Crossref]
- Lee DH, Iwanski GB, Thoennissen NH (2010) Cucurbitacin: Ancient Compound Shedding New Light on Cancer Treatment. ScientificWorldJournal 10: 413-418. [Crossref]
- Su Y, Li G, Zhang X, Gu J, Zhang C, et al. (2008) JSI-124 inhibits glioblastoma multiforme cell proliferation through G (2) /M cell cycle arrest and apoptosis augment. Cancer Biol Ther 7: 1243-1249. [Crossref]
- van Kester MS, Out-Luiting JJ, von dem Borne PA, Willemze R, Tensen CP, et al. (2008) Cucurbitacin I inhibit Stat3 and induces apoptosis in Sezary cells. J Invest Dermatol 128: 1691-1695. [Crossref]
- Blaskovich MA, Sun J, Cantor A, Turkson J, Jove R, et al. (2003) Discovery of JSI-124 (cucurbitacin I), a selective Janus kinase/signal transducer and activator of transcription 3 signaling pathway inhibitor with potent antitumor activity against human and murine cancer cells in mice. Cancer Res 63: 1270-1279. [Crossref]
- Song J, Liu H, Li Z, Yang C, Wang C (2015) Cucurbitacin I inhibit cell migration and invasion and enhances chemosensitivity in colon cancer. Oncol Rep 33: 1867-1871. [Crossref]
- Deng C, Zhang B, Zhang S, Duan C, Cao Y, et al. (2016) Low nanomolar concentrations of Cucurbitacin-I induces G2/M phase arrest and apoptosis by perturbing redox homeostasis in gastric cancer cells in vitro and in vivo. Cell Death Dis 7: e2106. [Crossref]
- Yu H, Kortylewski M, Pardoll D (2007) Crosstalk between cancer and immune cells: role of STAT3 in the tumour microenvironment. Nat Rev Immunol 7: 41-51. [Crossref]
- Yu H, Pardoll D, Jove R (2009) STATs in cancer inflammation and immunity: a leading role for STAT3. Nat Rev Cancer 9: 798-809. [Crossref]