Journals
A Systematic Review of the Utility of Frailty and Sarcopenia Measures in Patients undergoing Surgery for Gastrointestinal Cancer
A B S T R A C T
Background: Identifying patient factors that impact the risks associated with and outcomes following resectional gastrointestinal (GI) cancer surgery is a potentially important strategy in achieving improved cancer survival.
Methods: A search of Medline, BNI, Cochrane, Embase and CINAHL databases was performed, and English language publications of the period 1990–2016 reporting on the outcome of survival following gastrointestinal cancer surgery in patients that underwent an assessment of either frailty or sarcopenia pre-operatively were included.
Results:26 articles were included. Two studies compared methods of frailty assessment, ten studies assessed either frailty or aspects of a comprehensive geriatric assessment (CGA) as a predictor of outcome, and fourteen studies assessed sarcopenia as a predictor of outcome. 2 studies found that CGA assessment was an accurate method of assessment, with the abbreviated CGA having an accuracy rate of 83% against a reference standard of a geriatric assessment, and another study found identification of significantly more patients as frail compared to a physical phenotype alone (43% vs 13% in physical phenotype of frailty, respectively). A significant difference in 90-day, 1 year and 5-year survival was seen between frail and non-frail patients (90-day survival: OR 10.4, 95% CI 7.6-14.2, p < 0.001; 1- year survival: OR 8.4, 95% CI 6.4-11.1, p < 0.001; 5- year survival 66% vs 24% frail vs non-frail, respectively).
Conclusions: There is clear evidence that increased frailty and sarcopenia leads to a reduction in short- and long-term survival. Patients should undergo frailty or sarcopenia assessment, but the best means of assessment remains unclear.
K E Y W O R D S
Frailty, comprehensive, geriatric assessment, geriatrics, elderly, surgery, sarcopenia
Introduction
Half of all cancers in the United Kingdom are diagnosed in patients aged 70 or older [1]. This age group also has the lowest survival rate [1]. To achieve a reasonable chance of cure, surgical intervention is the gold-standard. Given the co-morbidity burden of these patients, the toll of potential neoadjuvant treatment, coupled with the highly traumatic and physiologically demanding nature of surgery, many patients are not deemed to be eligible, due to the risk of morbidity and mortality outweighing the potential benefits. Traditionally, clinical judgement and/or anaesthetic assessment with newer tests such as cardiopulmonary exercise testing (CPET) in the outpatient setting are used to give an idea of a patient’s functional status [2]. More recently however, the idea of frailty is coming to the fore, which is not strictly age-related, but linked to a loss of physical and functional reserve [3]. The methods of frailty assessment have been widely investigated, with a plethora of scoring systems and assessment criteria. Some form part of a comprehensive geriatric assessment (CGA) used by skilled geriatricians in assessing patients. However, other clinicians who may benefit from assessing patients in a similar manner who lack specialist training are able to use other screening tools which require minimal training and are more easily carried out. An example of this is the Edmonton Frailty Scale (EFS), a well-validated multi-domain frailty screening tool [4].
Other methods of assessing at-risk patients are by screening for sarcopenia. As outlined by the European Working Group on Sarcopenia in Older People (EWGSOP), sarcopenia is defined as "a syndrome characterised by progressive and generalised loss of skeletal muscle mass and strength with a risk of adverse outcomes such as physical disability, poor quality of life and death” [5]. The prevalence of sarcopenia in the general population above the age of 50 years has been quoted as being up to 29% [6].
Sarcopenia can be extrapolated from axial imaging by assessing muscle mass and visceral fat. As the majority of patients on a cancer management pathway will have computed tomography (CT) imaging, there is an opportunity to provide additional information without further investigations or treatment delay. The main issue to be addressed is how to assess patients on cancer pathways for frailty in a timely manner and whether this will have any impact on their postoperative outcomes.
The aim of this paper was to systematically review the evidence to see if positive frailty and/or sarcopenia assessment are predictors of poorer outcomes after gastrointestinal surgery for a malignant indication in the older patient population and whether there is a significant impact on short and long-term survival.
Material and Methods
Search Strategy & Article Selection
Figure 1 outlines the search strategy employed. The keyword search terms and subject headings used were “frailty”, “comprehensive geriatric assessment”, “geriatrics”, “elderly”, “surgery” and “sarcopenia”. Combinations with the term “cancer” were also used. Medline, Embase, BNI, CINAHL, and Cochrane databases were systematically searched. Articles were selected that were published in the English Language during the years 1990-2017. Studies required a documented method of assessment for frailty or sarcopenia in relation to patients undergoing surgery for an intra-abdominal malignancy. Outcomes had to include morbidity and/or mortality assessment, or comparison of methods of assessments in patients undergoing intra-abdominal cancer surgery. Studies reporting a non-validated method of assessment for frailty/sarcopenia or validation studies were excluded. Mixed populations of patients requiring surgery for a benign and/or malignant indication were also excluded. Patients who underwent neoadjuvant treatment were still considered eligible, as were those who underwent emergent surgery for a new primary tumour on an acute admission.
The reference lists of other relevant review publications were additionally scrutinised. MP reviewed the process and inclusion of eligible papers in accordance with the Preferred Reporting Items for Systematic Reviews and Meta-Analyses (PRISMA) flow chart [7].
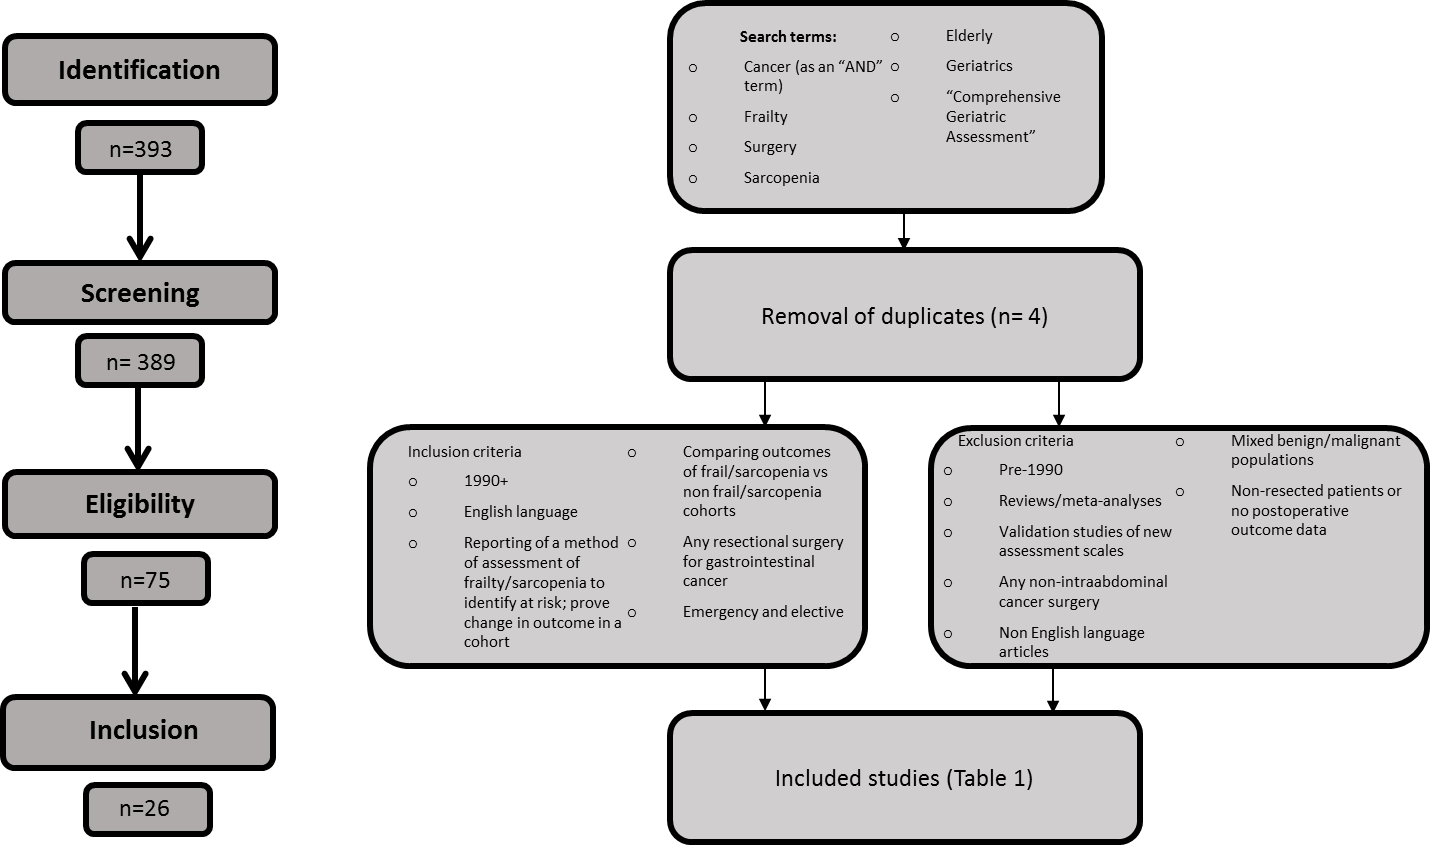
Figure 1: Summary of process of study inclusion in review.
Data Extraction
The studies were identified by MP and data extracted. The search strategy was ratified by DB and validation of the studies and data were performed independently by all co-authors. The quoted assessment strategies were checked for validation. A consensus was reached in areas of controversy. The International Prospective Register of Systematic Reviews (PROSPERO) registration number is CRD42018090268 where details of the protocol of this systematic review can be accessed [8].
Studies identified for inclusion were assessed for quality and risk of bias using the Newcastle-Ottawa Assessment Scale for the assessment of cohort studies [9].
Results
Included studies
The database search identified 75 articles of potential interest (excluding duplication). Seven additional articles were identified from the reference lists of identified papers. Respective eligibility criteria were reported in all articles.
After exclusion according to the criteria outlined in (Figure 1), 26 articles were included in the final analysis (Table 1). 33,786 patients were included in the final analysis. The length of postoperative follow up ranged from the immediate postoperative period to 8 years [10]. The articles covered the following themes:
- Articles that compared methods of frailty assessment (2 studies)
- Articles that assessed frailty as a predictor of outcome (6 studies)
- Articles that assessed aspects of CGA as a predictor of outcome (4 studies)
- Articles that looked at sarcopenia as a predictor of outcome (14 studies)
Table 1 summarises the quality assessment of the studies. The quality of the studies was generally acceptable although there were no studies that were completely free of bias. There were no randomized controlled studies identified for inclusion in the review and therefore there were no blinded studies, limiting the overall quality of included data. All cohort studies reported patient follow-up and had good patient study retention. All primary and secondary outcomes initially stated in the individual study were reported in the study’s final analysis.
Table 1: Summary of studies included.
|
Author |
Design |
Country |
Outcome measure of interest |
Measure of quality Newcastle-Ottawa Scale (cohort studies) |
||
|
Selection (/4) |
Comparability(/2) |
Outcome (/3) |
||||
|
Kenig11 |
C |
Poland |
Comparison of methods of assessment |
2 |
0 |
2 |
|
Kristjansson12 (2012) |
C, M |
Norway |
Comparison of methods of assessment |
4 |
1 |
2 |
|
Badgwell20 |
C |
US |
Assessment of CGA as a predictive tool for postoperative morbidity |
2 |
0 |
2 |
|
Kristjansson21 (2010) |
C, M |
Norway |
Assessment of CGA as a predictive tool for postoperative morbidity |
3 |
0 |
2 |
|
Indrakusuma22 |
C |
The Netherlands |
Assessment of CGA as a predictive tool for postoperative morbidity |
4 |
1 |
2 |
|
Pujara23 |
C |
US |
Assessment of CGA as a predictive tool for postoperative morbidity |
3 |
0 |
2 |
|
Tan13 |
C, M |
Singapore, Japan |
Assessment of frailty as a predictive tool for postoperative morbidity & mortality |
2 |
0 |
2 |
|
Hodari14 |
R, C |
US |
Assessment of frailty as a predictive tool for postoperative morbidity & mortality & mortality |
3 |
0 |
2 |
|
Reisinger28 |
C |
The Netherlands |
Assessment of sarcopenia as a predictive tool for postoperative morbidity/mortality |
2 |
0 |
2 |
|
Augustin15 |
R, C |
US |
Assessment of frailty as a predictive tool for postoperative morbidity & mortality |
3 |
0 |
2 |
|
Neuman16 |
R, C |
US |
Assessment of frailty as a predictive tool for postoperative morbidity & mortality |
4 |
2 |
2 |
|
Ommundsen17 |
C |
Norway |
Assessment of frailty as a predictive tool for postoperative morbidity & mortality |
3 |
2 |
2 |
|
Rønning18 |
C |
Norway |
Assessment of frailty as a predictive tool for postoperative morbidity & mortality |
2 |
0 |
2 |
|
Fukuda25 |
C |
Japan |
Assessment of sarcopenia as a predictive tool for postoperative morbidity/mortality |
3 |
1 |
2 |
|
Chen24 |
C |
China |
Assessment of sarcopenia as a predictive tool for postoperative morbidity/mortality |
2 |
0 |
2 |
|
Sheetz26 |
R, C |
US |
Assessment of sarcopenia as a predictive tool for postoperative morbidity/mortality |
3 |
0 |
2 |
|
Zhuang27 |
R, C |
China |
Assessment of sarcopenia as a predictive tool for postoperative morbidity/mortality |
4 |
2 |
2 |
|
Buettner29 |
C |
US |
Assessment of sarcopenia as a predictive tool for postoperative morbidity/mortality |
2 |
1 |
2 |
|
Delitto30 |
C |
US |
Assessment of sarcopenia as a predictive tool for postoperative morbidity/mortality |
2 |
0 |
2 |
|
Peng31 |
C |
US |
Assessment of sarcopenia as a predictive tool for postoperative morbidity/mortality |
3 |
0 |
2 |
|
Harimoto32 |
R, C |
Japan |
Assessment of sarcopenia as a predictive tool for postoperative morbidity/mortality |
2 |
0 |
2 |
|
Itoh33 |
C |
Japan |
Assessment of sarcopenia as a predictive tool for postoperative morbidity/mortality |
3 |
1 |
2 |
|
Voron34 |
C |
France |
Assessment of sarcopenia as a predictive tool for postoperative morbidity/mortality |
3 |
1 |
2 |
|
Lieffers35 |
C |
Canada |
Assessment of sarcopenia as a predictive tool for postoperative morbidity/mortality |
4 |
2 |
2 |
|
Sabel36 |
R, C |
US |
Assessment of sarcopenia as a predictive tool for postoperative morbidity/mortality |
4 |
2 |
2 |
|
van Vledder10 |
R, C |
The Netherlands |
Assessment of sarcopenia as a predictive tool for postoperative morbidity/mortality |
3 |
1 |
2 |
C= cohort, M=multicentre, R= retrospective.
Comparison of methods of frailty/CGA assessment
There are relatively few studies directly comparing methods of frailty screening with particular attention to intra-abdominal cancer patients undergoing surgery. This is likely due to the multimodal makeup of these screening methods limiting direct comparison. However, it is important to identify if easier, less involved methods are clinically useful as they can potentially be adapted for use by non-geriatricians in other clinical domains. The review identified two studies that directly compared methods of assessment in this particular group of patients (Table 2). Kenig et al. compared eight screening tests to assess whether their sensitivities and specificities were comparable [11]. The reference standard was a geriatric assessment (GA). Frail patients were identified in 40-75% of cases by the different methods. The accuracy rates ranged from 61-84% amongst the eight tests. Overall, when comparing the sensitivity, specificity, positive and negative predictive values, the abbreviated Comprehensive Geriatric Assessment proved to be the most accurate overall, with an overall accuracy rate of 84% (95% CI 73-91), followed by the Geriatric 8 (G8), with a sensitivity of 97% (95% CI 89-98), negative predictive value of 84% (95% CI 57-93) and overall accuracy rate of 83%. Both of these tests are specifically developed for oncology patients, which may account for their increased accuracy (the other 6 tests are not). They found that all the tests improved in accuracy with age by influencing the predictive value of the test, but accuracy was not affected by gender or type of cancer.
Kristjansson et al. compared a physical phenotype of frailty with multi-domain CGA assessment to compare their ability to i) identify frail patients and ii) to investigate their predictive power in identifying those at risk for postoperative morbidity [12]. They found that although both these methods predicted survival, CGA assessment alone predicted post-operative complications (p=0.001) and also identified more patients as being frail (43% vs 13% in physical phenotype of frailty, respectively).
Table 2: Comparison of methods of assessment.
|
Study |
Design |
Sample |
Mean age± SD; range in () |
Operation |
Principal study findings |
|
Kenig11 |
C |
135 |
75 ± 6.6; (65-92) |
Gastric (8%); Pancreas (17%); colon (42%); rectum (23%); other (10%) |
Accuracy rate of CGA= 84% (95% CI 73-91) and Geriatric 8 (G8)= 83% |
|
Kristjansson (2012)12 |
C, M |
176 |
†80; (70-94) |
Colorectal tumour resection |
CGA identified 43% of patients as frail compared to 13% of patients identified as physically frail Frailty predictor of mortality (HR 3.39, 95% CI 1.82-6.29) as well as TNMIV staging and both combined (HR 11.87, 95% CI 5.52-23.74). |
C= cohort, M=multicentre, R= retrospective, †=median, PS = performance status, CGA = comprehensive geriatric assessment, G8= Geriatric 8, NPV = negative predictive value.
Frailty as a predictor of outcome
As a predictor of survival
Six studies assessed frailty or frailty indicators as a predictor of survival (Table 3). The methods of frailty assessment differed among the studies. Four studies were in colorectal cancer patients and one study each looked at cohorts undergoing oesophago-gastric surgery and pancreatic surgery. Five studies found a significant difference in survival rates at varying time-points between frail and non-frail groups [13-17]. As a retrospective study, Neuman et al. used the John Hopkins Adjusted Clinical Groups (ACG) tool, which is a risk adjustment tool to predict a patient’s morbidity burden based on electronic medical data and demographics, and from this inferred those that make up a frailty phenotype [16]. They looked at 90-day and 1-year survival and found a significant difference between frail and non-frail patients for both time points (90-day survival: OR 10.4, 95% CI 7.6-14.2, p < 0.001; 1-year survival: OR 8.4, 95% CI 6.4-11.1, p < 0.001). Ommundsen et al. looked further at overall survival at 5 years [17]. They also found a significant difference between frail and non-frail groups in both localized and regional disease, with frailty being an independent risk factor for poorer survival (frail group: HR 3.6; 95% CI 2.3-5.5, p < 0.001, compared to reference group (non-frail cohort).
Table 3: Studies assessing frailty as a predictive tool for post-operative morbidity and mortality
|
Study |
Design |
Sample |
Mean age± SD; range in () |
Operation |
Principal study findings |
|
Tan13 |
C, M |
83 |
81.5 (75-93) |
Colorectal tumour resection |
OR of post-operative major complications 4.083 (95% CI 1.433-11.638) in frail patients |
|
Hodari14 |
R, C |
2095 |
n/r |
Esophagectomy |
Increasing mortality rate (1.8% in non-frail group vs 23.1% in highest frailty group) and post-operative complication rate with higher frailty scores |
|
Augustin15 |
R, C |
13020 |
*62.3 (58-72) |
Pancreato-duodenectomy (67%) & distal pancreatectomy (33%) |
Statistically significant difference in Clavien-DIndo 4 complication rate and death between frail and non-frail groups (P<0.001) |
|
Neuman16 |
R, C |
12979 |
84.4 ± 3.7 (patients aged ≥ 80 years) 73.9 ± 3.4 (control group aged ≤ 80 years) |
Colorectal tumour resection |
Frailty is an independent risk factor for 5-year survival (HR 3.6; 95% CI 2.3-5.5) in both localized and regional disease (log rank p value <0.001 and p=0.007, respectively) |
|
Ommundsen17 |
C |
178 |
†80; (70-94) |
Colorectal tumour resection |
Frailty an independent marker of five-year survival irrespective of TNM stage (HR 3.6, 95% CI 2.3-5.5, p<0.001) |
|
Rønning18 |
C |
84 |
†82 years (72-95) |
Colorectal tumour resection |
Significant association between post-operative complications and reduced grip strength at follow-up. No indicators of frailty individually associated with poorer physical function at follow-up |
C= cohort, M=multicentre, R= retrospective, CI = confidence interval, OR= odds ratio, HR= hazard ratio, SD= standard deviation, *=pooled mean for grouped data, †=median values quoted in study, n/r= not reported.
As a predictor of post-operative complications
Four studies looked specifically at frailty as an independent predictor of post-operative complications [13-15, 18]. Tan et al. assessed frailty using criteria based on Fried et al. that incorporated grip strength, 15ft walk time and physical activity as well as described weight loss and exhaustion [13, 19]. They found that frailty conferred a four-fold increase in the risk of complications graded as Clavien-Dindo II or higher (OR = 4.083, 95% CI 1.433-11.638, P=0.006). These serious complications were both surgical and medical, and included anastomotic leak, intra-abdominal collection, chest infection, prolonged ileus, wound dehiscence and acute coronary syndrome. Having studied multiple parameters including; tumour stage, American Society of Anaesthesiologists physical status classification system (ASA), BMI, biochemical markers and frailty, they noted that frailty was the only variable to show an association. In a cohort of colorectal cancer patients, Rønning et al. were unable to identify any significant association between the variables constituting the frailty assessment used and outcome, save for an association between post-operative complications and reduced grip strength at follow-up (OR 6.5, 95% CI 1.2-35.8) [18]. In a retrospective cohort of patients having undergone pancreatic resections, Augustin et al. attempted to isolate variables that make up frailty assessment that independently increase the risk of post-operative complications and mortality [15]. They showed that by removing 3 index variables, (a history of MI, diabetes and cerebrovascular accident (CVA) with neurological deficit), their 8- point frailty assessment still correlated with increased morbidity and mortality.
CGA as a predictor of outcome
Four studies assessed the use of CGA as a predictor of outcome (Table 4) [20-23]. All studies showed that high-risk patients had an increased risk of either complications or increased length of hospital stay. Kristjansson et al. as part of a large multicentre Norwegian study found that the relative risk of complications following elective colorectal tumour resection surgery between frail and non-frail groups was 1.59 (95% CI 1.25-2.01) [21]. After adjustment, CGA-proven frailty increased the risk of severe complications by a factor of 3 (OR 3.13, 95% CI 1.65-5.92). Pujara et al. identified a need to improve pre-operative performance status, after showing an increase in post-operative complications in patients who scored highly on predictors of frailty; namely poly-pharmacy (OR 2.36, 95% CI 1.08-5.17) and weight loss >10% within 6 months (OR 11.21, 95% CI 2.16-58.24) in a cohort of patients having undergone subtotal or total gastrectomy for gastric adenocarcinoma [23]. Used as part of the CGA, ECOG-PS was a strong predictor of 30-day readmission rates as well as T stage (ECOG-PS: OR=3.55, 95% CI 1.45-8.69, P < 0.01; T stage: OR=0.29, 95% CI 0.12-0.7, P < 0.01, respectively) and was also independently predictive of an increased length of hospital stay. Age was also found to be an independent predictor of length of stay (ages 55-74: OR=2.22, 95% CI 1.16-4.23, age ≥75: OR 3.93, 95% CI 1.68-9.22, p < 0.01). Indrakusuma et al. reported that following interventions for patients identified as high risk, those patients originally identified as frail had comparable outcomes compared to matched controls following intervention despite being initially at higher risk of post-operative morbidity [22]. They also reported that underlying cognitive impairment identified on pre-operative assessment was a significant predictor of post-operative delirium (OR=5.583, 95% CI 1.886-16.528, P=0.02). Badgewell et al. showed that CGA can help predict patients who may benefit from increased length of stay or discharge to supportive care [20].
Sarcopenia as an independent predictor of outcome
Fourteen studies used pre-operative computed tomography (CT) images to define a surrogate marker for sarcopenia and ascertain whether it is an independent predictor of adverse outcome (Table 5) [10, 24-36]. The methodology for defining sarcopenia was similar, with the exception of Fukuda et al. who used the European Working Group on Sarcopenia in Older People (EWGSOP) algorithm (Table 5) [5].
Table 4: Studies assessing CGA as a predictive tool for post-operative morbidity
|
Study |
Design |
Sample |
Mean age± SD; range in () |
Operation |
Principal study findings |
|
Badgwell20 |
C |
111 |
72 (65-89) |
Colorectal (40%), hepatopancreatobiliary (30%), gastric/duodenal (14%) |
Predictors of increased hospital stay include polypharmacy (OR 2.45, 95% CI 1.09-5.48) and weight loss >10% (OR 4.03, 95% CI 1.13-14.4) |
|
Kristjansson (2010)21 |
C, M |
178 |
79.6 ± 5.7 (70-94) |
Colorectal tumour resection |
Relative risk of any complication between frail and non-frail populations 1.59 (95% CI 1.25-2.01) ASA classification not a predictor of overall complications (p=0.11) or Clavien-Dindo Class II or above (p=0.12) |
|
Indrakusuma 201522 |
C |
443 |
†77 (73-82) |
Colorectal tumour resection |
Cognitive impairment identified on assessment significant predictor of post-operative delirium (OR = 5.583, 95% CI 1.886-16.528; p=002) |
|
Pujara23 |
C |
279 |
65 (25-88) |
Subtotal (52%) or total (48%) gastrectomy |
Predictors of Clavien-Dindo Class III OR IV complications include polypharmacy (OR 2.36, 95% CI 1.08-5.17) and weight loss >10% within 6 months (OR 11.21, 95% CI 2.16-58.24) |
C= cohort, M=multicentre, R= retrospective, CI = confidence interval, HR= hazard ratio, IQR= inter-quartile range, OR= odds ratio, SD= standard deviation, *=pooled mean for grouped data, †=median values quoted in study, n/r= not reported, polypharmacy defined as 5 or more daily oral medications.
Table 5: Studies assessing sarcopenia as a predictive tool for post-operative morbidity/mortality
|
Study |
Design |
Sample |
Mean age± SD; range in () |
Operation |
Methodology to measure sarcopenia (all studies normalized for patient height) |
Principal study findings |
|
Chen24 |
C |
158 |
66.9±8.7 |
Gastrectomy and D2 lympnadenectomy |
A cross-sectional CT image of the third lumbar vertebra (L3) was selected for estimating muscle mass (psoas, erector spina, quadratus lumborum, transversus abdominis, external and internal obliques and rectus abdominins) |
Significant increase in complication rate in SCP group compared to N-SCP group with sarcopenia as an independent risk factor OR 3.084 (95% CI 1.395-6.820) |
|
Fukuda25 |
C |
99 |
SCP group 78 (67-85) N-SCP group 75 (66-91) |
Gastrectomy |
Sarcopenia defined according to the EWGSOP algorithm criteria5 |
Overall complication rate insignificant between 2 groups (p=0.08); Significant difference in Clavien-Dindo Class ≥IIIa complications in SCP vs N-SCP groups (28.6% vs 9.0%; p=0.029) |
|
Sheetz26 |
R, C |
230 |
62.3 ± 9.4 |
Transhiatal oesophagectomy |
The cross-sectional area and density of the left and right psoas muscles were measured at the fourth lumbar vertebral level (L4). |
In patients not receiving neoadjuvant chemoradiation, higher LPA correlated with significantly better OS (HR=0.308; 95% CI 0.116-0.820, P=0.018) and DFS (HR = 0.334; 95% CI 0.139-0.802, P= 0.014). No significant difference in neoadjuvant chemoradiation group in OS (P=0.311) or DFS (P= 0.433) |
|
Zhuang27 |
R, C |
937 |
†64 (IQR 15) |
Gastrectomy |
A cross-sectional CT image of the third lumbar vertebra (L3) was selected for estimating muscle mass (psoas, erector spina, quadratus lumborum, transversus abdominis, external and internal obliques and rectus abdominis) |
Significant increase in severe complication rate in SCP group compared to N-SCP group with sarcopenia as an independent risk factor OR 3.010 (95% CI 1.732-5.228, P<0.001) |
|
Reisinger28 |
C |
310 |
69 (SEM 0.6) |
Scheduled and acute colorectal tumour resection |
A cross-sectional CT image of the third lumbar vertebra (L3) using L3 muscle area surfaces |
After adjustment for other variables sarcopenia is an independent risk factor for mortality (OR= 43.30 (95% CI 2.74-685.2, P=0.007) but not anastomotic leakage, (OR 0.57, 95% CI 0.28-1.19, P=0.13) or sepsis (OR = 1.49 95% CI 0.50-4.39, P= 0.47) |
|
Buettner29 |
C |
640 |
†62.5 (IQR 53-70) |
Hepatobiliary (26.2%), pancreatic (48.3%) or colorectal tumour (25.5%) resection |
TPA- measured with a manual outlining of the psoas muscle borders at the level of the third lumbar vertebra (L3) TPV-measured with 3 manual measurements at the level of the L3 vertebra on the first image where both iliac crests are clearly visible. |
Sarcopenia independent risk factor for increased risk of 1-year mortality (HR = 1.98, 95% CI 1.36 to 2.88, P<0.001)
|
|
Delitto30 |
C |
73 |
n/r |
Pancreato-duodenectomy |
Psoas index = average psoas cross-sectional area divided by the area of the L3 vertebral body on axial CT image. |
Psoas index is an independent predictor of survival (HR 0.021; P = .003) |
|
Peng31 |
C |
557 |
65.7±10.6 |
Pancreato-duodenectomy (86%) & distal pancreatectomy (14%) |
TPA = the cross sectional area of the right and left psoas muscles at the level of L3 on axial CT image. |
Sarcopenia is an independent risk factor for increased 3-year mortality after adjustment for other variables (HR 1.63, 95% CI 1.28-2.07, p<0.001) |
|
Harimoto32 |
R, C |
186 |
SCP: 67±11 N-SCP: 66±10 |
Hepatectomy for hepatocellular carcinoma |
A cross-sectional CT image of the third lumbar vertebra (L3) was selected for estimating muscle mass (psoas, erector spina, quadratus lumborum, transversus abdominis, external and internal obliques and rectus abdominis) |
At 5 years, sarcopenic patients had significantly worse OS (P=0.001) and DFS (P=0.013); OS rates for SCP vs N-SCP groups 71% vs 83.7%, respectively; DFS rates for SCP vs N-SCP groups 13% and 33.2%, respectively, |
|
Itoh33 |
C |
190 |
Low VFA- 68 (34-87) High VFA 69 (31-83) |
Hepatectomy for hepatocellular carcinoma |
VFA = measuring pixels with densities of -190 to -30 Hounsfield units at level of umbilicus in axial view. Sarcopenia = A cross-sectional CT image of the third lumbar vertebra (L3) was selected for estimating muscle mass (psoas, erector spina, quadratus lumborum, transversus abdominis, external and internal obliques and rectus abdominis). |
No significant difference in post-operative complications between 2 groups
Sarcopenia stronger indicator of poorer OS than low VFA (Sarcopenia: HR = 1.96 95% CI 1.06-3.74, P=0.031; Low VFA: HR = 1.51 95% CI 0.80-2.83, P=0.194) |
|
Voron34 |
C |
109 |
61.6±13.3 |
Hepatectomy for hepatocellular carcinoma |
Sarcopenia measured using a cross-sectional CT image of the third lumbar vertebra (L3) using L3 muscle area surfaces to ascertain skeletal muscle index |
Sarcopenia independently associated with poor DFS (HR=3.03 95% CI 1.67-5.49, P<0.001), more so than age alone (HR=0.53 95% CI 0.31-0.93, P=0.026) |
|
Lieffers35 |
C |
234 |
63±12 |
Colorectal tumour resection |
Sarcopenia measured using a cross-sectional CT image of the third lumbar vertebra (L3) using L3 muscle area surfaces to ascertain skeletal muscle index |
Sarcopenia independently associated with increased risk of infection (OR=4.6 95% CI 1.5-13.9, P=0.007), more so than tumour stage (OR=0.45 95% CI 0.14-1.5, P=0.42) Sarcopenia predicts longer total length of hospital stay SCP group: 15.9 ± 14.2 days vs N-SCP group: 12.3 ± 9.8 days, P=0.038) |
|
Sabel36 |
R, C |
302 |
67.9±12.4 (26-94) |
Colorectal tumour resection |
Cross‐sectional areas of the left and right psoas muscles at the level of the fourth lumber vertebra (L4) were measured to determine psoas area and psoas density. Also measured total body fat, visceral fat and subcutaneous fat using average distance between linea alba and anterior skin along T12 to L4 |
For every unit change, psoas density is an independent predictor of an infectious complication (OR= 1.05, 95% CI 1.02-1.08, P=0.003) Psoas density not a significant predictor of outcome after adjustment for age and Charlson score (median follow-up 2.81 years) |
|
van Vledder10 |
R, C |
196 |
†64.5 (31-86) |
Colorectal liver metastectomy |
To measure skeletal muscle and intra-abdominal fat, cross-sectional areas of different tissue compartments were measured at the caudal end of the third lumbar vertebra. |
Significant difference in DFS (SCP; 8.7 months vs N-SCP; 15.1 months, P=0.002) and median OS between two groups (SCP; 23.8 months vs N-SCP; 59.8 months, P=0.001; median follow up of 29 months, range 1-96 months) |
C= cohort, M=multicentre, R= retrospective, SCP = sarcopenic, N-SCP = non-sarcopenic, EWGSOP = European Working Group on Sarcopenia in Older People, CI = confidence interval, DFS= disease-free survival, HR= hazard ratio, IQR= inter-quartile range, OR= odds ratio, OS= overall survival, SEM= standard error of the mean, SD= standard deviation, VFA = visceral fat area *=pooled mean for grouped data, †=median values quoted in study, n/r= not reported.
As a predictor of postoperative complications
There were conflicting conclusions with regards to sarcopenia as a risk factor for post-operative complications. Chen et al. found that sarcopenia conferred a threefold increase in risk of post-operative complications (OR=3.084, P=0.005) after total gastrectomy with D2 lymphadenectomy [24]. Lieffers et al. also showed that sarcopenia was a stronger predictor of post-operative complications than tumour stage and predicted a significantly longer length of stay following colorectal tumour resection (sarcopenic group: 15.9 ± 14.2 days vs non-sarcopenic group: 12.3 ± 9.8 days, P=0.038) [32].
In contrast, Fukuda, Reisinger and Itoh et al., in a combined total of 559 patients, did not demonstrate a significant difference in post-operative complications between sarcopenic and non-sarcopenic groups in colorectal cancer and hepatocellular carcinoma patients, respectively [25, 28, 33]. Reisinger looked specifically at the rates of anastomotic leak and sepsis and did not find a significant increase (anastomotic leak: OR=0.57 95% CI 0.28-1.19, P=0.13; sepsis: OR=1.49 95% CI 0.50-4.39 P=0.47) in the sarcopenic group vs non-sarcopenic group [28]. However, combined with a functional assessment the risk of sepsis increased (OR= 25.1, 95% CI 5.11-123, P=0.001), highlighting the potential need for a more detailed assessment in order to accurately reflect those at risk. When looking at serious complications, Fukuda did show a significant difference in Clavien-Dindo Class ≥IIIa complications based on sarcopenia (sarcopenic group = 28.6% vs non-sarcopenic group = 9.0%, P=0.029) [25].
As a predictor of overall survival/disease-free survival
In patients with pancreatic and hepato-biliary disease undergoing liver and/or pancreatic resections, significantly worse outcomes were demonstrated by authors for sarcopenic patients at 1, 3 and 5 years [29, 31, 32]. Buettner et al. showed that sarcopenia was an independent risk factor for higher 1- year mortality rates in a population of 640 patients (HR=1.98, 95% CI 1.36 – 2.88, P < 0.001) [29]. Peng and Harimoto found poor mortality rates at 3 and 5 years, respectively (Peng: HR 1.63, 95% CI 1.28-2.07, p < 0.001, n=557; Harimoto: HR=0.90, 95% CI0.84-0.96, p=0.002, n=186) [31, 32].
Van Vledder et al. showed a significant difference in median disease-free survival rates between demographically similar sarcopenic and non-sarcopenic patients (van Vledder: 8.7 months vs 15.1 months, respectively) with only 15% of sarcopenic patients being disease-free at years following colo-rectal liver metastectomy compared to 28.5% of non-sarcopenic patients [10]. Similarly, Voron showed sarcopenia as an independent predictor of poorer DFS following hepatectomy for hepatocellular carcinoma. (HR=3.03 95% CI 1.67-5.49, P < 0.001) [34]. However, after adjustment for age and Charlson score (a co-morbidity index that can predict a patients’ 10-year mortality based on pre-existing health conditions) With a median follow-up of 2.81 years, Sabel et al. could not demonstrate psoas density as a marker of poorer outcome after multivariate analysis, but it was the single best predictor of any complication (OR 0.96 95% CI 0.94-0.99, p=0.004) [36]. It may be that single muscle analysis is not sufficient to use as a surrogate marker for sarcopenia.
Conclusion
The studies included in this review are heterogeneous, differing in design, tumour type and the methodology used to identify patient frailty. However, it is striking to note that despite the difference in type of assessment tool employed, the tumour site and stage, all studies showed that reported outcome data for frailty were associated with an increase in one or more of the following: length of hospital stay; frequency or severity of post-operative complications including infection/sepsis; increased post-operative mortality and/or reductions in 1, 3 and 5 year overall survival. This clearly highlights that frailty is an important consideration (potentially as important as tumour stage) for surgeons planning resection gastro-intestinal surgery for malignancies. Furthermore, successful identification and intervention for frailty represents a significant therapeutic target in improving survival rates.
Frailty assessment is a useful adjunct that can yield beneficial information that is sometimes missed during traditional history-taking and can help identify issues that often delay post-operative discharge [37]. This paper does not explore the validity of the different types of assessment, as their multimodal setup is difficult to compare and there are a plethora of different scoring systems available [38]. CGA is highly sensitive in identifying at-risk patients who would benefit from geriatric intervention, especially as this cohort of patients have been shown to have poorer outcomes across a range of different cancers, irrespective of tumour staging. However, these studies are based on Geriatrician assessment, requiring specialist level intervention and whilst, inter-specialty referral and pre-optimisation of patients for surgery is a well-recognized service that can improve outcomes in care, undertaking this within the urgent timeframe for cancer surgery is inexpedient [39]. Simple screening tools such as the EFS are useful to identify at-risk patients (routinely performed at our centre) and can be easily used by non-Geriatric healthcare professionals in order to appropriately select those patients who may benefit from more in-depth assessment by a specialist. Furthermore, in an era of resource rationing, it may be more prudent to identify a manner of screening all patients rather than referral of patients above a particular age for detailed CGA by a specialist clinician. Sarcopenic assessment via CT provides a timely, cost-effective method of screening which has been clearly shown to identify those who are at higher risk of mortality and morbidity following surgery. This as an initial method of screening for all-comers, can allow a more in-depth assessment and management plan by a specialist geriatrician in high risk patients to help mitigate their potentially poorer outcome.
Following this review of the literature, it is clear that the impact of frailty and sarcopenia on outcomes is universally significant and there is a trend towards poorer outcomes across different tumour groups. The lack of randomized controlled trials and the mainly retrospective design of the papers included in this review allow large patient cohorts to be assessed but does not facilitate real-time assessment for frailty or CGA, instead relying on previous co-morbidity documentation, which can be open to significant error in capture. Few articles elaborate on the existing expertise of the clinician performing the assessments, and no study has performed dual assessment by separate clinicians in order to attempt standardisation.
The sarcopenia papers are almost wholly derived from Eastern populations, with different risk factors and demographics from those seen in the West, as such a multi-centre trial looking at sarcopenia in Western GI cancer populations may yield different results.
Despite this, recognition of sarcopenia on pre-operative CT imaging as a method to identify patients at risk of frailty remains an attractive proposition, facilitating early identification of patients in whom multi-disciplinary intervention can be instigated in order to reduce the risk of post-operative complications and subsequently improve morbidity and mortality. Interventions such as pre-operative physiotherapy and/or exercise regimens have been in place in other fields, such as elective abdominal aortic aneurysm repair, and within the confines of the urgent treatment pathway may have a role to play to help pre-condition patients [40, 41]. Frailty assessment can help to highlight patients who may benefit from more intensive dietetic intervention and/or social support for discharge and select patients who may require in-hospital geriatric review [20].
In conclusion, given the well-demonstrated poorer outcomes for high-risk frail patients and the potential for improvements, frailty assessment should be considered for all patients, with a comprehensive geriatric assessment being a wholly appropriate tool for this cancer subset. There is paucity in the literature of comparisons of various tools specifically for cancer patients that can be used specifically by non-Geriatricians, and in centres with limited access to inter-specialty combined assessment the identification of at-risk patients using sarcopenia criteria is wholly appropriate, can be performed with no additional steps in the cancer assessment pathway and within existing resources. Whether frailty assessment is more sensitive than sarcopenia alone in cancer patients is an area for more research.
Statement of Authorship
All authors contributed to the study design, planning and data extraction. M Paul & DJ Bowrey drafted the initial manuscript. R Williams & I Edwards revised the initial manuscript. All authors have seen and approved the final draft.
Conflict of Interest
The authors declare no conflicts of interest.
Article Info
Article Type
Research ArticlePublication history
Received: Tue 09, Oct 2018Accepted: Fri 26, Oct 2018
Published: Mon 24, Dec 2018
Copyright
© 2023 Paul M. This is an open-access article distributed under the terms of the Creative Commons Attribution License, which permits unrestricted use, distribution, and reproduction in any medium, provided the original author and source are credited. Hosting by Science Repository.DOI: 10.31487/j.ACO.2018.01.003
Author Info
Corresponding Author
Paul MDepartment of Oesophago-Gastric Surgery, Leicester Royal Infirmary
Figures & Tables
Table 1: Summary of studies included.
|
Author |
Design |
Country |
Outcome measure of interest |
Measure of quality Newcastle-Ottawa Scale (cohort studies) |
||
|
Selection (/4) |
Comparability(/2) |
Outcome (/3) |
||||
|
Kenig11 |
C |
Poland |
Comparison of methods of assessment |
2 |
0 |
2 |
|
Kristjansson12 (2012) |
C, M |
Norway |
Comparison of methods of assessment |
4 |
1 |
2 |
|
Badgwell20 |
C |
US |
Assessment of CGA as a predictive tool for postoperative morbidity |
2 |
0 |
2 |
|
Kristjansson21 (2010) |
C, M |
Norway |
Assessment of CGA as a predictive tool for postoperative morbidity |
3 |
0 |
2 |
|
Indrakusuma22 |
C |
The Netherlands |
Assessment of CGA as a predictive tool for postoperative morbidity |
4 |
1 |
2 |
|
Pujara23 |
C |
US |
Assessment of CGA as a predictive tool for postoperative morbidity |
3 |
0 |
2 |
|
Tan13 |
C, M |
Singapore, Japan |
Assessment of frailty as a predictive tool for postoperative morbidity & mortality |
2 |
0 |
2 |
|
Hodari14 |
R, C |
US |
Assessment of frailty as a predictive tool for postoperative morbidity & mortality & mortality |
3 |
0 |
2 |
|
Reisinger28 |
C |
The Netherlands |
Assessment of sarcopenia as a predictive tool for postoperative morbidity/mortality |
2 |
0 |
2 |
|
Augustin15 |
R, C |
US |
Assessment of frailty as a predictive tool for postoperative morbidity & mortality |
3 |
0 |
2 |
|
Neuman16 |
R, C |
US |
Assessment of frailty as a predictive tool for postoperative morbidity & mortality |
4 |
2 |
2 |
|
Ommundsen17 |
C |
Norway |
Assessment of frailty as a predictive tool for postoperative morbidity & mortality |
3 |
2 |
2 |
|
Rønning18 |
C |
Norway |
Assessment of frailty as a predictive tool for postoperative morbidity & mortality |
2 |
0 |
2 |
|
Fukuda25 |
C |
Japan |
Assessment of sarcopenia as a predictive tool for postoperative morbidity/mortality |
3 |
1 |
2 |
|
Chen24 |
C |
China |
Assessment of sarcopenia as a predictive tool for postoperative morbidity/mortality |
2 |
0 |
2 |
|
Sheetz26 |
R, C |
US |
Assessment of sarcopenia as a predictive tool for postoperative morbidity/mortality |
3 |
0 |
2 |
|
Zhuang27 |
R, C |
China |
Assessment of sarcopenia as a predictive tool for postoperative morbidity/mortality |
4 |
2 |
2 |
|
Buettner29 |
C |
US |
Assessment of sarcopenia as a predictive tool for postoperative morbidity/mortality |
2 |
1 |
2 |
|
Delitto30 |
C |
US |
Assessment of sarcopenia as a predictive tool for postoperative morbidity/mortality |
2 |
0 |
2 |
|
Peng31 |
C |
US |
Assessment of sarcopenia as a predictive tool for postoperative morbidity/mortality |
3 |
0 |
2 |
|
Harimoto32 |
R, C |
Japan |
Assessment of sarcopenia as a predictive tool for postoperative morbidity/mortality |
2 |
0 |
2 |
|
Itoh33 |
C |
Japan |
Assessment of sarcopenia as a predictive tool for postoperative morbidity/mortality |
3 |
1 |
2 |
|
Voron34 |
C |
France |
Assessment of sarcopenia as a predictive tool for postoperative morbidity/mortality |
3 |
1 |
2 |
|
Lieffers35 |
C |
Canada |
Assessment of sarcopenia as a predictive tool for postoperative morbidity/mortality |
4 |
2 |
2 |
|
Sabel36 |
R, C |
US |
Assessment of sarcopenia as a predictive tool for postoperative morbidity/mortality |
4 |
2 |
2 |
|
van Vledder10 |
R, C |
The Netherlands |
Assessment of sarcopenia as a predictive tool for postoperative morbidity/mortality |
3 |
1 |
2 |
C= cohort, M=multicentre, R= retrospective.
Table 2: Comparison of methods of assessment.
|
Study |
Design |
Sample |
Mean age± SD; range in () |
Operation |
Principal study findings |
|
Kenig11 |
C |
135 |
75 ± 6.6; (65-92) |
Gastric (8%); Pancreas (17%); colon (42%); rectum (23%); other (10%) |
Accuracy rate of CGA= 84% (95% CI 73-91) and Geriatric 8 (G8)= 83% |
|
Kristjansson (2012)12 |
C, M |
176 |
†80; (70-94) |
Colorectal tumour resection |
CGA identified 43% of patients as frail compared to 13% of patients identified as physically frail Frailty predictor of mortality (HR 3.39, 95% CI 1.82-6.29) as well as TNMIV staging and both combined (HR 11.87, 95% CI 5.52-23.74). |
C= cohort, M=multicentre, R= retrospective, †=median, PS = performance status, CGA = comprehensive geriatric assessment, G8= Geriatric 8, NPV = negative predictive value.
Table 3: Studies assessing frailty as a predictive tool for post-operative morbidity and mortality
|
Study |
Design |
Sample |
Mean age± SD; range in () |
Operation |
Principal study findings |
|
Tan13 |
C, M |
83 |
81.5 (75-93) |
Colorectal tumour resection |
OR of post-operative major complications 4.083 (95% CI 1.433-11.638) in frail patients |
|
Hodari14 |
R, C |
2095 |
n/r |
Esophagectomy |
Increasing mortality rate (1.8% in non-frail group vs 23.1% in highest frailty group) and post-operative complication rate with higher frailty scores |
|
Augustin15 |
R, C |
13020 |
*62.3 (58-72) |
Pancreato-duodenectomy (67%) & distal pancreatectomy (33%) |
Statistically significant difference in Clavien-DIndo 4 complication rate and death between frail and non-frail groups (P<0.001) |
|
Neuman16 |
R, C |
12979 |
84.4 ± 3.7 (patients aged ≥ 80 years) 73.9 ± 3.4 (control group aged ≤ 80 years) |
Colorectal tumour resection |
Frailty is an independent risk factor for 5-year survival (HR 3.6; 95% CI 2.3-5.5) in both localized and regional disease (log rank p value <0.001 and p=0.007, respectively) |
|
Ommundsen17 |
C |
178 |
†80; (70-94) |
Colorectal tumour resection |
Frailty an independent marker of five-year survival irrespective of TNM stage (HR 3.6, 95% CI 2.3-5.5, p<0.001) |
|
Rønning18 |
C |
84 |
†82 years (72-95) |
Colorectal tumour resection |
Significant association between post-operative complications and reduced grip strength at follow-up. No indicators of frailty individually associated with poorer physical function at follow-up |
C= cohort, M=multicentre, R= retrospective, CI = confidence interval, OR= odds ratio, HR= hazard ratio, SD= standard deviation, *=pooled mean for grouped data, †=median values quoted in study, n/r= not reported.
Table 4: Studies assessing CGA as a predictive tool for post-operative morbidity
|
Study |
Design |
Sample |
Mean age± SD; range in () |
Operation |
Principal study findings |
|
Badgwell20 |
C |
111 |
72 (65-89) |
Colorectal (40%), hepatopancreatobiliary (30%), gastric/duodenal (14%) |
Predictors of increased hospital stay include polypharmacy (OR 2.45, 95% CI 1.09-5.48) and weight loss >10% (OR 4.03, 95% CI 1.13-14.4) |
|
Kristjansson (2010)21 |
C, M |
178 |
79.6 ± 5.7 (70-94) |
Colorectal tumour resection |
Relative risk of any complication between frail and non-frail populations 1.59 (95% CI 1.25-2.01) ASA classification not a predictor of overall complications (p=0.11) or Clavien-Dindo Class II or above (p=0.12) |
|
Indrakusuma 201522 |
C |
443 |
†77 (73-82) |
Colorectal tumour resection |
Cognitive impairment identified on assessment significant predictor of post-operative delirium (OR = 5.583, 95% CI 1.886-16.528; p=002) |
|
Pujara23 |
C |
279 |
65 (25-88) |
Subtotal (52%) or total (48%) gastrectomy |
Predictors of Clavien-Dindo Class III OR IV complications include polypharmacy (OR 2.36, 95% CI 1.08-5.17) and weight loss >10% within 6 months (OR 11.21, 95% CI 2.16-58.24) |
C= cohort, M=multicentre, R= retrospective, CI = confidence interval, HR= hazard ratio, IQR= inter-quartile range, OR= odds ratio, SD= standard deviation, *=pooled mean for grouped data, †=median values quoted in study, n/r= not reported, polypharmacy defined as 5 or more daily oral medications.
Table 5: Studies assessing sarcopenia as a predictive tool for post-operative morbidity/mortality
|
Study |
Design |
Sample |
Mean age± SD; range in () |
Operation |
Methodology to measure sarcopenia (all studies normalized for patient height) |
Principal study findings |
|
Chen24 |
C |
158 |
66.9±8.7 |
Gastrectomy and D2 lympnadenectomy |
A cross-sectional CT image of the third lumbar vertebra (L3) was selected for estimating muscle mass (psoas, erector spina, quadratus lumborum, transversus abdominis, external and internal obliques and rectus abdominins) |
Significant increase in complication rate in SCP group compared to N-SCP group with sarcopenia as an independent risk factor OR 3.084 (95% CI 1.395-6.820) |
|
Fukuda25 |
C |
99 |
SCP group 78 (67-85) N-SCP group 75 (66-91) |
Gastrectomy |
Sarcopenia defined according to the EWGSOP algorithm criteria5 |
Overall complication rate insignificant between 2 groups (p=0.08); Significant difference in Clavien-Dindo Class ≥IIIa complications in SCP vs N-SCP groups (28.6% vs 9.0%; p=0.029) |
|
Sheetz26 |
R, C |
230 |
62.3 ± 9.4 |
Transhiatal oesophagectomy |
The cross-sectional area and density of the left and right psoas muscles were measured at the fourth lumbar vertebral level (L4). |
In patients not receiving neoadjuvant chemoradiation, higher LPA correlated with significantly better OS (HR=0.308; 95% CI 0.116-0.820, P=0.018) and DFS (HR = 0.334; 95% CI 0.139-0.802, P= 0.014). No significant difference in neoadjuvant chemoradiation group in OS (P=0.311) or DFS (P= 0.433) |
|
Zhuang27 |
R, C |
937 |
†64 (IQR 15) |
Gastrectomy |
A cross-sectional CT image of the third lumbar vertebra (L3) was selected for estimating muscle mass (psoas, erector spina, quadratus lumborum, transversus abdominis, external and internal obliques and rectus abdominis) |
Significant increase in severe complication rate in SCP group compared to N-SCP group with sarcopenia as an independent risk factor OR 3.010 (95% CI 1.732-5.228, P<0.001) |
|
Reisinger28 |
C |
310 |
69 (SEM 0.6) |
Scheduled and acute colorectal tumour resection |
A cross-sectional CT image of the third lumbar vertebra (L3) using L3 muscle area surfaces |
After adjustment for other variables sarcopenia is an independent risk factor for mortality (OR= 43.30 (95% CI 2.74-685.2, P=0.007) but not anastomotic leakage, (OR 0.57, 95% CI 0.28-1.19, P=0.13) or sepsis (OR = 1.49 95% CI 0.50-4.39, P= 0.47) |
|
Buettner29 |
C |
640 |
†62.5 (IQR 53-70) |
Hepatobiliary (26.2%), pancreatic (48.3%) or colorectal tumour (25.5%) resection |
TPA- measured with a manual outlining of the psoas muscle borders at the level of the third lumbar vertebra (L3) TPV-measured with 3 manual measurements at the level of the L3 vertebra on the first image where both iliac crests are clearly visible. |
Sarcopenia independent risk factor for increased risk of 1-year mortality (HR = 1.98, 95% CI 1.36 to 2.88, P<0.001)
|
|
Delitto30 |
C |
73 |
n/r |
Pancreato-duodenectomy |
Psoas index = average psoas cross-sectional area divided by the area of the L3 vertebral body on axial CT image. |
Psoas index is an independent predictor of survival (HR 0.021; P = .003) |
|
Peng31 |
C |
557 |
65.7±10.6 |
Pancreato-duodenectomy (86%) & distal pancreatectomy (14%) |
TPA = the cross sectional area of the right and left psoas muscles at the level of L3 on axial CT image. |
Sarcopenia is an independent risk factor for increased 3-year mortality after adjustment for other variables (HR 1.63, 95% CI 1.28-2.07, p<0.001) |
|
Harimoto32 |
R, C |
186 |
SCP: 67±11 N-SCP: 66±10 |
Hepatectomy for hepatocellular carcinoma |
A cross-sectional CT image of the third lumbar vertebra (L3) was selected for estimating muscle mass (psoas, erector spina, quadratus lumborum, transversus abdominis, external and internal obliques and rectus abdominis) |
At 5 years, sarcopenic patients had significantly worse OS (P=0.001) and DFS (P=0.013); OS rates for SCP vs N-SCP groups 71% vs 83.7%, respectively; DFS rates for SCP vs N-SCP groups 13% and 33.2%, respectively, |
|
Itoh33 |
C |
190 |
Low VFA- 68 (34-87) High VFA 69 (31-83) |
Hepatectomy for hepatocellular carcinoma |
VFA = measuring pixels with densities of -190 to -30 Hounsfield units at level of umbilicus in axial view. Sarcopenia = A cross-sectional CT image of the third lumbar vertebra (L3) was selected for estimating muscle mass (psoas, erector spina, quadratus lumborum, transversus abdominis, external and internal obliques and rectus abdominis). |
No significant difference in post-operative complications between 2 groups
Sarcopenia stronger indicator of poorer OS than low VFA (Sarcopenia: HR = 1.96 95% CI 1.06-3.74, P=0.031; Low VFA: HR = 1.51 95% CI 0.80-2.83, P=0.194) |
|
Voron34 |
C |
109 |
61.6±13.3 |
Hepatectomy for hepatocellular carcinoma |
Sarcopenia measured using a cross-sectional CT image of the third lumbar vertebra (L3) using L3 muscle area surfaces to ascertain skeletal muscle index |
Sarcopenia independently associated with poor DFS (HR=3.03 95% CI 1.67-5.49, P<0.001), more so than age alone (HR=0.53 95% CI 0.31-0.93, P=0.026) |
|
Lieffers35 |
C |
234 |
63±12 |
Colorectal tumour resection |
Sarcopenia measured using a cross-sectional CT image of the third lumbar vertebra (L3) using L3 muscle area surfaces to ascertain skeletal muscle index |
Sarcopenia independently associated with increased risk of infection (OR=4.6 95% CI 1.5-13.9, P=0.007), more so than tumour stage (OR=0.45 95% CI 0.14-1.5, P=0.42) Sarcopenia predicts longer total length of hospital stay SCP group: 15.9 ± 14.2 days vs N-SCP group: 12.3 ± 9.8 days, P=0.038) |
|
Sabel36 |
R, C |
302 |
67.9±12.4 (26-94) |
Colorectal tumour resection |
Cross‐sectional areas of the left and right psoas muscles at the level of the fourth lumber vertebra (L4) were measured to determine psoas area and psoas density. Also measured total body fat, visceral fat and subcutaneous fat using average distance between linea alba and anterior skin along T12 to L4 |
For every unit change, psoas density is an independent predictor of an infectious complication (OR= 1.05, 95% CI 1.02-1.08, P=0.003) Psoas density not a significant predictor of outcome after adjustment for age and Charlson score (median follow-up 2.81 years) |
|
van Vledder10 |
R, C |
196 |
†64.5 (31-86) |
Colorectal liver metastectomy |
To measure skeletal muscle and intra-abdominal fat, cross-sectional areas of different tissue compartments were measured at the caudal end of the third lumbar vertebra. |
Significant difference in DFS (SCP; 8.7 months vs N-SCP; 15.1 months, P=0.002) and median OS between two groups (SCP; 23.8 months vs N-SCP; 59.8 months, P=0.001; median follow up of 29 months, range 1-96 months) |
C= cohort, M=multicentre, R= retrospective, SCP = sarcopenic, N-SCP = non-sarcopenic, EWGSOP = European Working Group on Sarcopenia in Older People, CI = confidence interval, DFS= disease-free survival, HR= hazard ratio, IQR= inter-quartile range, OR= odds ratio, OS= overall survival, SEM= standard error of the mean, SD= standard deviation, VFA = visceral fat area *=pooled mean for grouped data, †=median values quoted in study, n/r= not reported.
References
1. UK Cancer Research: Cancer Incidence by Age. Accessed May 15, 2017.
2. Moran J, Wilson F, Guinan E, McCormick P, Hussey J, et al. (2016) Role of cardiopulmonary exercise testing as a risk-assessment method in patients undergoing intra-abdominal surgery: a systematic review. Br J Anaesth 116: 177-91. [Crossref]
3. Partridge JS, Harari D, Dhesi JK (2012) Frailty in the older surgical patient: a review. Age Ageing 41: 142-147. [Crossref]
4. Rolfson DB, Majumdar SR, Tsuyuki RT, Tahir A, Rockwood K (2006) Validity and reliability of the Edmonton Frail Scale. Age Ageing 35: 526-529. [Crossref]
5. Cruz-Jentoft AJ, Baeyens JP, Bauer JM, Boirie Y, Cederholm T, et al. (2010) Sarcopenia: European consensus on definition and diagnosis. Age Ageing 39: 412-423. [Crossref]
6. Cruz-Jentoft AJ, Landi F, Schneider SM, Zúñiga C, Arai H, et al. (2014) Prevalence of and interventions for sarcopenia in ageing adults: a systematic review. Report of the International Sarcopenia Initiative (EWGSOP and IWGS). Age Ageing 43: 748-759. [Crossref]
7. Moher D, Liberati A, Tetzlaff J, Altman DG, PRISMA Group (2009) Preferred reporting items for systematic reviews and meta-analyses: the PRISMA statement. Ann Intern Med 151: 264-269. [Crossref]
8. Paul M, Bowrey DJ, Williams RN, Edwards I. A systematic review of the utility of frailty and sarcopenia measures in patients with gastrointestinal cancer undergoing surgery. PROSPERO 2018 CRD42018090268.
9. Wells GA, Shea B, O’Connell D, et al. (2009) The Newcastle-Ottawa Scale (NOS) for assessing the quality if nonrandomized studies in meta-analyses.
10. Van Vledder M, Levolger S, Ayez N, Verhoef C, Tran TC, et al. (2012) Body composition and outcome in patients undergoing resection of colorectal liver metastases. Br J Surg 99: 550-557. [Crossref]
11. Kenig J, Zychiewicz B, Olszewska U, Richter P (2015) Screening for frailty among older patients with cancer that qualify for abdominal surgery. J Geriatr Oncol 6: 52-59. [Crossref]
12. Kristjansson SR, Rønning B, Hurria A, Skovlund E, Jordhøy MS, et al. (2012) A comparison of two pre-operative frailty measures in older surgical cancer patients. J Geriatr Oncol 3: 1-7.
13. Tan K-Y, Kawamura YJ, Tokomitsu A, Tang T (2012) Assessment for frailty is useful for predicting morbidity in elderly patients undergoing colorectal cancer resection whose comorbidities are already optimized. Am J Surg 204: 139-143. [Crossref]
14. Hodari A, Hammoud ZT, Borgi JF, Tsiouris A, Rubinfeld IS (2013) Assessment of morbidity and mortality after esophagectomy using a modified frailty index. Ann Thorac Surg 96: 1240-1245. [Crossref]
15. Augustin T, Burstein MD, Schneider EB, Morris-Stiff G, Wey J, et al. (2016) Frailty predicts risk of life-threatening complications and mortality after pancreatic resections. Surgery 160: 987-996. [Crossref]
16. Neuman HB, Weiss JM, Leverson G, O'Connor ES, Greenblatt DY, et al. (2013) Predictors of short-term postoperativeerative survival after elective colectomy in colon cancer patients ≥ 80 years of age. Ann Surg Oncol 20: 1427-1435. [Crossref]
17. Ommundsen N, Wyller TB, Nesbakken A, Jordhøy MS, Bakka A, et al. (2014) Frailty is an independent predictor of survival in older patients with colorectal cancer. Oncologist 19: 1268-1275. [Crossref]
18. Rønning B, Wyller TB, Jordhøy MS, Nesbakken A, Bakka A, et al. (2014) Frailty indicators and functional status in older patients after colorectal cancer surgery. J Geriatr Oncol 5: 26-32. [Crossref]
19. Fried LP, Tangen CM, Walston J, Newman AB, Hirsch C, et al. (2001) Frailty in older adults: evidence for a phenotype. J Gerontol A Biol Sci Med Sci 56: 146-157. [Crossref]
20. Badgwell B, Stanley J, Chang GJ, Katz MH, Lin HY, et al. (2013) Comprehensive geriatric assessment of risk factors associated with adverse outcomes and resource utilization in cancer patients undergoing abdominal surgery. J Surg Oncol 108: 182-186. [Crossref]
21. Kristjansson SR, Nesbakken A, Jordhøy MS, Skovlund E, Audisio RA, et al. (2010) Comprehensive geriatric assessment can predict complications in elderly patients after elective surgery for colorectal cancer: a prospective observational cohort study. Crit Rev Oncol Hematol 76: 208-217. [Crossref]
22. Indrakusuma R, Dunker M, Peetoom J, Schreurs W (2015) Evaluation of preoperative geriatric assessment of elderly patients with colorectal carcinoma. A retrospective study. Eur J Surg Oncol 41: 21-27. [Crossref]
23. Deep Pujara, Paul Mansfield, Jaffer Ajani, Mariela Blum, Elena Elimova, et al. (2015) Comprehensive geriatric assessment in patients with gastric and gastroesophageal adenocarcinoma undergoing gastrectomy. J Surg Oncol 112: 883-887. [Crossref ]
24. Chen F, Zhang F, Zhou X, Shen X, Yu Z, et al. (2016) Role of frailty and nutritional status in predicting complications following total gastrectomy with D2 lymphadenectomy in patients with gastric cancer: a prospective study. Langenbecks Arch Surg 401: 813-822. [Crossref]
25. Fukuda Y, Yamamoto K, Hirao M, Nishikawa K, Nagatsuma Y, et al. (2016) Sarcopenia is associated with severe postoperativeerative complications in elderly gastric cancer patients undergoing gastrectomy. Gastric Cancer 19: 986-993. [Crossref]
26. K. H. Sheetz, L. Zhao, S. A. Holcombe, S. C. Wang, R. M. Reddy, et al. (2013) Decreased core muscle size is associated with worse patient survival following esophagectomy for cancer. Dis Esophagus 26: 716-722. [Crossref]
27. Zhuang CL, Huang DD, Pang WY, Zhou CJ, Wang SL, et al. (2016) Sarcopenia is an independent predictor of severe postoperativeerative complications and long-term survival after radical gastrectomy for gastric cancer: analysis from a large-scale cohort. Medicine (Baltimore) 95: e3164. [Crossref]
28. Reisinger KW, van Vugt JLA, Tegels JJW, Snijders C, Hulsewé KWE, et al. (2015) Functional compromise reflected by sarcopenia, frailty, and nutritional depletion predicts adverse postoperativeerative outcome after colorectal cancer surgery. Ann Surg 261: 345-352. [Crossref]
29. Buettner S, Wagner D, Kim Y, Margonis GA, Makary MA, (2016) et al. Inclusion of Sarcopenia Outperforms the Modified Frailty Index in Predicting 1-Year Mortality among 1,326 Patients Undergoing Gastrointestinal Surgery for a Malignant Indication. J Am Coll Surg 222: 397-407. [Crossref]
30. Delitto D, Judge SM, George TJ Jr., Sarosi GA, Thomas RM, et al. (2016) A clinically applicable muscular index predicts long-term survival in resectable pancreatic cancer. Surgery 161: 930-938. [Crossref]
31. Peng P, Hyder O, Firoozmand A, Kneuertz P, Schulick RD, et al. (2012) Impact of sarcopenia on outcomes following resection of pancreatic adenocarcinoma. J Gastrointest Surg 16: 1478-1486. [Crossref]
32. Harimoto N, Shirabe K, Yamashita YI, Ikegami T, Yoshizumi T, et al. (2013) Sarcopenia as a predictor of prognosis in patients following hepatectomy for hepatocellular carcinoma. Br J Surg 100: 1523-1530. [Crossref]
33. Itoh S, Shirabe K, Matsumoto Y, Yoshiya S, Muto J, et al. (2014) Effect of body composition on outcomes after hepatic resection for hepatocellular carcinoma. Ann Surg Oncol 21: 3063-3068. [Crossref]
34. Voron T, Tselikas L, Pietrasz D, Pigneur F, Laurent A, et al. (2015) Sarcopenia impacts on short-and long-term results of hepatectomy for hepatocellular carcinoma. Ann Surg 261: 1173-1183. [Crossref]
35. Lieffers J, Bathe O, Fassbender K, Winget M, Baracos V (2012) Sarcopenia is associated with postoperativeerative infection and delayed recovery from colorectal cancer resection surgery. Br J Cancer 107: 931-936. [Crossref]
36. Sabel MS, Terjimanian M, Conlon AS, Griffith KA, Morris AM, et al. (2013) Analytic morphometric assessment of patients undergoing colectomy for colon cancer. J Surg Oncol 108: 169-175. [Crossref]
37. Iqbal J, Denvir M, Gunn J (2013) Frailty assessment in elderly people. Lancet 381: 1985-1986. [Crossref]
38. De Vries N, Staal J, Van Ravensberg C, Hobbelen J, Olde Rikkert MG, et al. (2011) Outcome instruments to measure frailty: a systematic review. Ageing Res Rev 10: 104-114. [Crossref]
39. Harari D, Hopper A, Dhesi J, Babic-Illman G, Lockwood L, et al. (2007) Proactive care of older people undergoing surgery (‘POPS’): designing, embedding, evaluating and funding a comprehensive geriatric assessment service for older elective surgical patients. Age Ageing 36: 190-196. [Crossref]
40. Barakat HM, Shahin Y, Barnes R, Gohil R, Souroullas P, et al. (2014) Supervised exercise program improves aerobic fitness in patients awaiting abdominal aortic aneurysm repair. Ann Vasc Surg 28: 74-79. [Crossref]
41. Valkenet K, van de Port IG, Dronkers JJ, de Vries WR, Lindeman E, et al. (2011) The effects of preoperative exercise therapy on postoperative outcome: a systematic review. Clin Rehabil 25: 99-111. [Crossref]