Journals
A novel theranostics nanoparticles pGGA-PTX / SPION with bifunction of diagnosis and treatment
A B S T R A C T
To increase the solubility of free drugs, drug-loaded efficiency and prolong the half-life of drugs in the body, a novel theranostics nano-particles, pGGA-PTX / SPION with a good diagnosis and treatment function have been fabricated. It is plump and uniform in size, to 113.0 ± 0.6nm, leading to the passive targeting of tumor tissue due to the EPR effect. The content-loaded of PTX was about 27.66%. The contrast agent content was about 6.34%. In vitro evaluation such as cell viability, the pGGA-PTX / SPION NPs were similar to that of PTX, suggesting a useful anticancer effect on tumor cells. In the H&E experiment, the pGGA-PTX / SPION did not impair the normal tissue and fully proved its safety performance. In vivo imaging, the pGGA-PTX / SPION in the tumor body can clearly be observed by NMR, to achieve real-time monitoring of drugs. In vivo treatment effects experiment, the pGGA-PTX / SPION exhibits a significant tumor growth inhibition effect.
K E Y W O R D S
Polymer delivery system, diagnosis and treatment, nanoparticles, contrast agent, PTX (Paclitaxel)
I N T R O D U C T I O N
Modern clinical medicine has gradually developed from the traditional "one-size-fits-all" to the new individualized treatment strategy. Advances in nanotechnology provide a possibility to integrate the diagnostic reagents and treatment reagents in a single system, which allows the doctor to reduce the time between diagnosis and treatment [1-5]. Among nanomaterials, the functionalized nanoparticles (NPs) play an important role in the field of individualized treatment [6-9]. Typical representatives are quantum dots as fluorescence imaging agent and magnetic NPs as nuclear magnetic resonance imaging agent (NMRI) [10-15]. The latter includes ferromagnetic iron oxide NPs and super paramagnetic iron oxide NPs (SPION) [16-20]. They exhibit distinct passive targeting to tumor tissue. In order to help facilitate the delivery in the body and prolong the circulation time of NPs, NPs are usually wrapped by polymers due to the improvement in the pharmacokinetics parameters of NPs [23-26]. Polymers are used as coating includes polyethylene glycol (PEG), dextran, chitosan, polyethylenimine (PEI) and phospholipids [27-31].
A successful nanodrug delivery system can prolong the circulating time of the drug in the body, enter the target cells, and release it through the regulatory mechanism within the cells [32]. In order to reduce the time between diagnosis and treatment of patients and improve the efficiency of treatment, many drugs are combined with magnetic NPs, including paclitaxel (PTX), doxorubicin and methotrexate [32-35]. Although the polymer-based contrast agent and the drug delivery system have been widely investigated, reported platform systems still have the following problems needed to be solved: (1) the preparation process is complex and time-consuming. Furthermore, large-scale production and reproducibility are still in question; (2) minimal loading of contrast agents and drug, and (3) biocompatibility of coating materials needed to be further improved.
PGGA-PTX is a modification of poly (L-glutamic acid)-paclitaxel conjugate (PGA-PTX) in which an additional glutamic acid has been added to each glutamic side chain. PGGA-PTX has higher water-solubility and faster dissolution than PGA-PTX. Unlike PGA-PTX, PGGA-PTX self-assembles into NPs. However, PGGA-PTX possesses lower toxicity compared with PGA-PTX in mice [40]. In this work, we encapsulated the contrast agent, SPION, by drug- loading polymer, PGGA-PTX through a simple emulsification method to construct a diagnostic and treatment system. This system shows advantages of high loading of drug, enhancement of tumor inhibition and reduction of the toxicity. Moreover, we can easily real-time monitor where the drug gathered, drug content in the tumor and metabolic situation.
Experimental
I Materials
PGA-PTX, SPION and pentobarbital sodium were bought from Sigma-Aldrich Co. Ltd, US. Sodium cholate was acquired from Acros Co. Ltd., Belgium. CCK-8 kit was obtained from the Boster Biological Technology Co. Ltd. Balb/c male nude mice (age 5 weeks) was supplied by the Institute of Brain Function, East China Normal University. U87 cell line (40 and 60 generations) was acquired from Shanghai Life Cell Library, Chinese Academy of Sciences.
II Preparation of pGGA-PTX / SPION NPs
PGG-PTX is a modification of poly (L-glutamic acid)-paclitaxel conjugate (PGA-PTX) in which an additional glutamic acid has been added to each glutamic side chain in the polymer. The synthesis of PGGA-PTX was carried out in accordance with reference [40]. 25g of pGGA-PTX was dissolved in 10 mL of 0.5% sodium cholate solution under stirring to give a clear colorless aqueous solution of pGGA-PTX. The methylene chloride and acetone were fully mixed together in a volume ratio of 1: 2. The SPION solution dispersed in toluene was added to 20 mL of a mixture of methylene chloride and acetone. Subsequently, the formed oil phase solution was dropwise added to the aqueous pGGA-PTX solution under stirring, followed by ultrasonication until the milky droplets gradually disappear. The color of the solution gradually changed from brown to light yellow. The mixture was placed in a rotary vial to remove acetone at 35℃. The obtained mixture was sonicated at room temperature for 20 min. After removing the solvents by freeze-drying, milky white and flocculent pGGA-PTX/ SPION NPs were obtained.
III Characterization
The morphology of the SPION, pGGA-PTX and pGGA-PTX/SPION NPs was characterized by a HRTEM (Hitachi H-9000). Particle size of three NPs was determined by laser particle analyzer, Mastersizer 2000 (Malvern Instrument LTD, UK). The amounts of PTX and SPION in pGGA-PTX/SPION were determined by UV spectrophotometer (OLYMPUS IMAGING) and ICP-MS (Perkin Elmer ELAN, US). The stability and weight loss of the three NPs were quantitatively determined by thermo-gravimetric analyzer (TA Instruments SDT-Q600, US). Cell counter and Millicell-ERS volt-ohmmeter (Merck Millipore), high performance liquid phase chromatography (HPLC) (shimadzu Co., LTD, Japan), Freezing microtome (Leica), Multiskan MK3 Automatic enzyme standard instrument, Embedded culture wells, Transwell Millipore Ltd. Co., Cell resistance meter, Millipore and the cell constant temperature incubator (Thermo Fisher Scientific) and NMI (Siemens Healthcare Erlangen, German) were used for relevant test.
IV Animal test
Male nude mice aged about 5 weeks were randomly classified into three groups. Eight rats in each group were inoculated with glial tumor tissue in the armpit area of about 2 × 2 × 2 mm3. Three groups of mice were grown under the same conditions. When the tumor volume was about 100 mm3, the mice were injected into three groups through the tail vein. The concentration of PTX was 1.5mg/ml in the experimental group and the control group were received a tail vein injection of the same amount of normal saline. Within the next 16 days, the volume of the tumor was measured with a vernier caliper every 2 days. The volume of the tumor is calculated as 1/2 (width 2 × length).
Results and Discussion
I Structure of the pGGA-PTX/SPION
PTX loading polymer can self-assemble into NPs, which can encapsulate contrast agent SPION to integrate into a shell core structure of pGGA-PTX/ SPION NPs, as depicted in Scheme 1. Its shell surface is hydrophilic, and the core is hydrophobic. It exhibits some passive targeting to tumor tissue in several degree due to the EPR effect. These features will be confirmed by subsequent TEM studies.
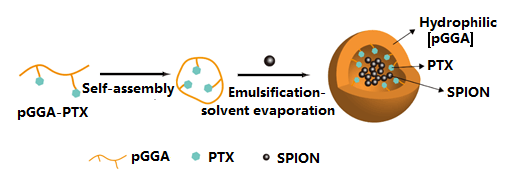
Scheme 1: Synthesis and structure of the pGGA-PTX/SPION.
II The morphologies of the NPs
The TEM results show that all NPs are spherical. The particle sizes of SPION is about 9nm (Fig. 1 A). Due to the hydrophobic side chains, pGGA-PTX is self-assembled to form nanoparticles with a size of ~ 60 nm, as shown in Fig. 1 B. In Fig. 1D, we can find that the SPION evenly distributed in the pGGA-PTX / SPION core, thus microscopically proved that due to SPION makes pGGA-PTX / SPION particle size increases slightly larger than PGGA-PTX NPs. Fig. 1 D is a partial enlarged picture of Fig. 1 C.
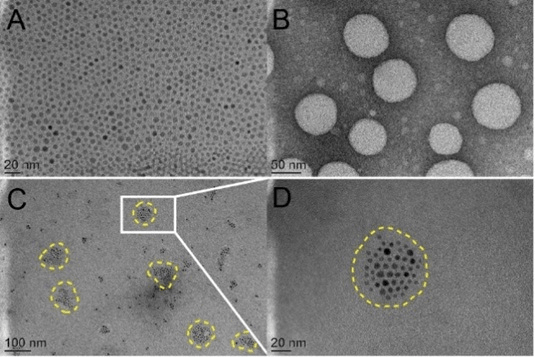
Figure 1: TEM imaged A. SPION, B. p-GG-PTX, C. pGG-PTX/SPION NPs and D is an enlarged image of C.
III Size distribution
In the field of pharmaceutical research and development, the particle size range of NPs is extremely important for the passive targeting of drugs. Tumor vascular tissue structure has a distinct structure, which is referred to the EPR effect. The EPR effect is the high permeability of the solid tumor in vivo and the retention effect. The direct effect of tumor EPR effect is that the vascular permeability in the tumor tissue is higher than that in the normal tissue, and the incompleteness is indicated. By using the specialty of the tumor, the NPs enter tumor more easily than that of the normal tissue, resulting in a therapeutic effect while reducing side effects on non-targeted cells. In this experiment, particle size of the pGG-PTX/SPION prepared is about 113.03 ± 0.6 nm (Figure 2 and Table 1), within the particle size range for the EPR effect. It has a nice passive targeting effect, and further speaking, the NPs reduce the non-targeted cell toxicity, improve safety.
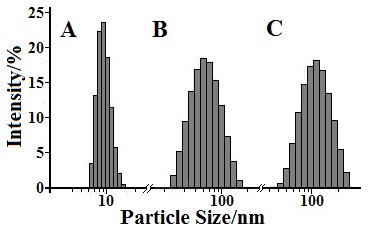
Figure 2: Size distribution of three NPs. A. SPION (from 6 to 10.7 nm), B. pGGA-PTX (from 32 to 108 nm), C. pGGA-PTX/ SPION (from 40 to 112 nm)
Table 1: Size, PDI, ξ potential, and LE of three NPs: SPION, pGGA-PTX and pGGA-PTX/ SPION.
|
Sample |
SPION |
pGGA-PTX |
pGGA-PTX/SPION |
|
size(nm) |
8.02±1.07 |
66.62±1.36 |
113.03±0.6 |
|
PDI |
0.22 |
0.21 |
0.17 |
|
ξ potential(mV)±SD |
-12.04±1.06 |
-30.00±2.00 |
-25.33±3.06 |
|
PTX LC (%) ± SD |
|
35.6 |
27.66 |
|
SPION LE (%) ± SD |
|
|
51.61±4.99 |
|
SPION LC (%) ± SD |
|
|
6.34±0.62 |
IV Drug loading capacity and SPION content in the NPs
The encapsulation efficiency and loading of SPION were measured by ICP-MS after acidification. The encapsulation efficiency and loading of SPION were 51.61 ± 4.99 and 6.34 ± 0.62, respectively (Table 1). Compared with other materials wrapped SPION which can be observed in the results of high LC%. The LC% (35.6%) of pGGA-PTX was higher than the LC% (27.66%) of pGGA-PTX / SPION by HPLC, which was due to the relative decrease in the proportion of PTX owing to the presence of SPION.
V Stability of the PGGA-PTX and pGGA-PTX/SPION
Figure 3 shows the TED curves for three NPs: SPION (A), pGGA-PTX / SPION (B) and pGGA-PTX (C). The weight loss of SPION NPs is not discernible with the increase of temperature. There is a little increase in the weight loss when the temperature is higher than 300 °C, which may be due to oxidation of SPION by the existed small amount of oxygen. PGGA-PTX and pGGA-PTX / SPION are not significantly changed when the temperature is lower than 100 ° C, indicating that the NPs are considerably stable. When the temperature reached 150 °C, the polymer started to decompose. Until 500 °C the curve tends to be stable, and at 800 °C the decomposition was finished. The final weight of the C curve is about 31.5 wt %, the B curve is 36.0 wt %. It can also be calculated that the multifunctional NPs contain a specific gravity of 6.2% by weight of SPION, confirming the previous SPION carrying capacity (6.34 wt %) measured by ICP.
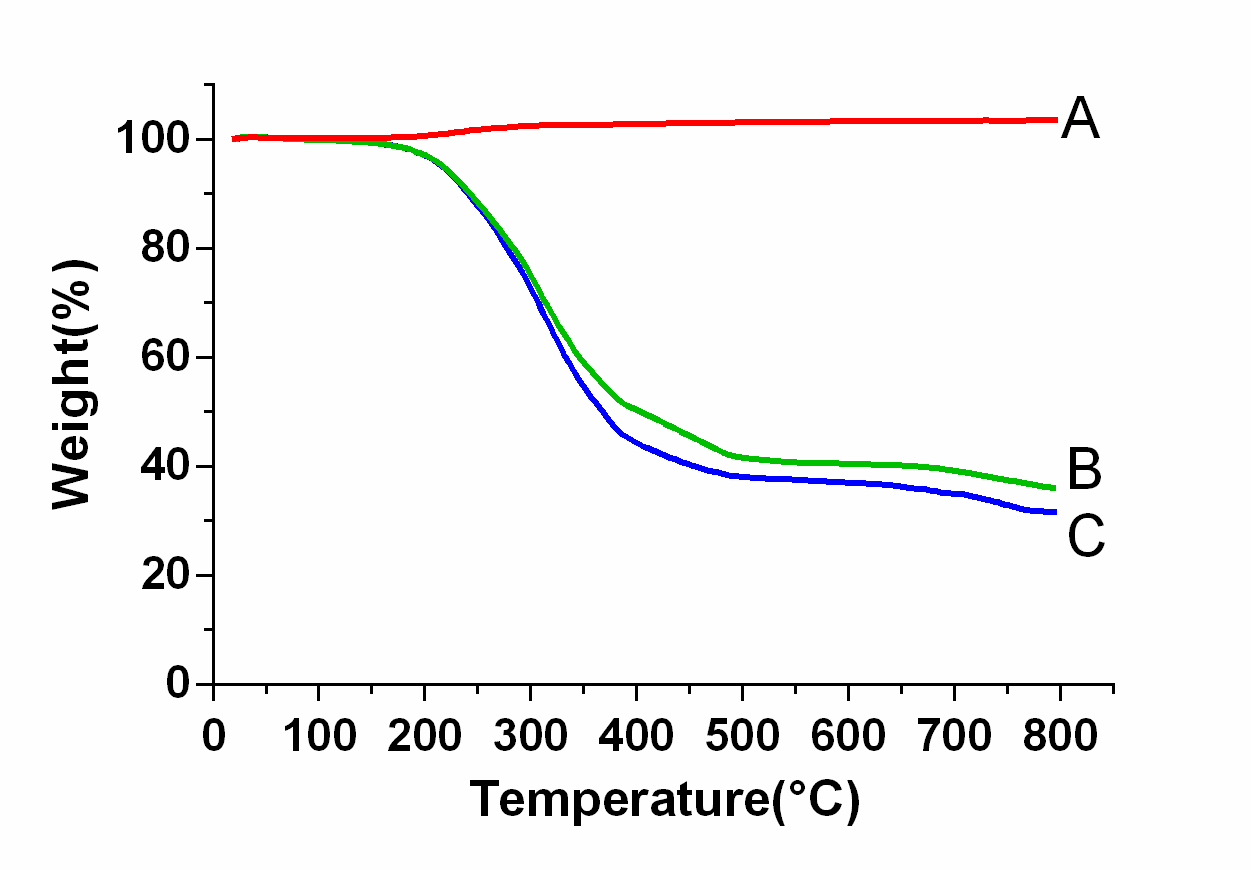
Figure 3: The TED curves for three NPs: SPION (A), pGGA-PTX/SPION (B) and pGGA-PTX/SPION NPs (C).
VI Cytotoxicity tests
Cytotoxicity experiments were performed using the CCK-8 kit (Refer Supplement 3). As showed in Fig. 4, the three experimental groups showed a decrease in the survival rate of the cells as the concentration of PTX increased. The overall survival rate of PTX group was comparable to that of pGGA-PTX / SPION. According to the latest study, SPION itself was not toxic and had no cytotoxic effect on cell level at cell level, but probably because of the physical properties of nanoparticles after SPION encapsulation changes, including the size of the particle size and the role of chemical bonds. pGGA-PTX makes PTX easier to separate from the high molecular skeleton, so the inhibition of U87 UGG effect is similar to that of PTX group. Compared to the two other groups, PGGA-PTX shows slightly lower capability to suppress tumor cells, which be due to not every PTX molecule in pGGA-PTX acts with the tumor cells. This will lead to no equivalent amount of PTX in the PGGA-PTX group.
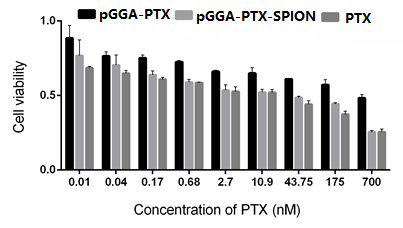
Figure 4: The survival rate of the U87 cells as the concentration of PTX increased.
VII TEM images
We can observe from (Figure 5) that the black SPION particles are not found in the control group A and B because of the saline was added to the samples. In the experimental group C, we can clearly see black spherical particles in the cytoplasm and organelles. By analyzing the particle size and morphology, we can conclude that the black particles in the area marked with a yellow border are pGGA-PTX /SPION particles (Figure 5C). Fig. 5D is an enlarged picture of (Figure 5 C). Therefore, it clearly illustrates that the pGG-PTX / SPION can enter tumor cells at the microscopic level.
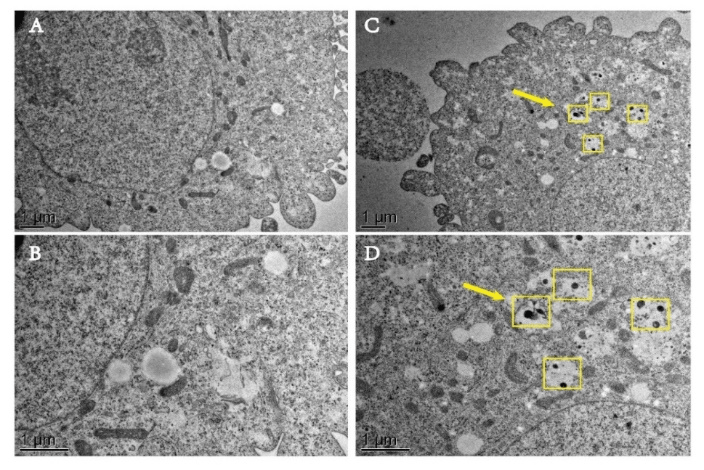
Figure 5: TEM images of the pGGA-PTX/SPION and contrast groups into the intracellular. A) and B) the control group, containing the same amount of saline in the sample; C) the experimental group containing 1.5 mg/ml of the pGGA-PTX/SPION, (D) is an enlarged image of C.
VIII Microscopic photographs
1 Prussian blue staining for detection of SPION
Figure 6 shows that microscopic photographs of the U87 glioma tissue slice after Prussian blue stained (Refer Supplement). Under normal circumstances, the nucleus was dyed into red and cytoplasm into pink, so we can clearly find the location of the cell to assess whether SPION into the U87 cells. The obvious blue was not observed in the control group with saline as showed in (Figure 6 A), indicating no SPION in the U87 tissue slice control group. In (Figure 6 B), a large number of blue area (Yellow arrow pointing) can be clearly seen, indicating that pGGA-PTX / SPION can enter the U87 tumor tissue cells inside.
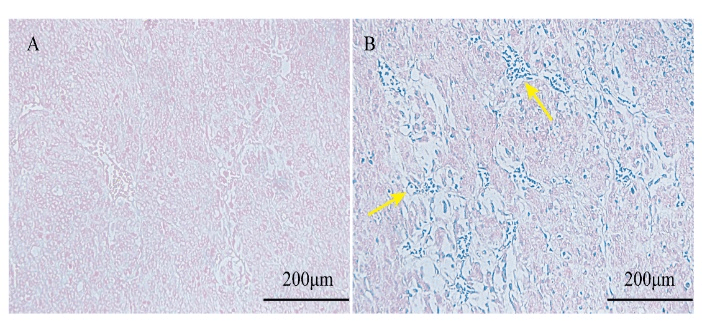
Figure 6: Microscopic photographs of the U87 glioma tissue slice after Prussian blue stained. A) for the control group with saline and B) for the experimental group with the pGGA-PTX/SPION.
2 Tumor images for pGGA-PTX / SPION
Figure 7 shows the images of normal tissues and tumor after H & E staining (Refer to supplement) [41]. The experiments consisted of three groups. The control group for the saline, the other two groups was pGGA-PTX / SPION and pGGA-PTX, respectively. H & E staining showed that there was no obvious necrosis in the heart, liver, spleen, lung and kidney, and there was no significant difference between the control group and the control group. However, tumor tissue for the control group was nearly intact, but PGGA-PTX / SPION and pGGA-PTX were significantly better than the control group. The degrees of inhibition on the tumor in both pGGA-PTX / SPION and pGGA-PTX are similar, sometimes pGGA-PTX / SPION will be better. Tumor inhibition effect for pGGA-PTX / SPION and pGGA-PTX may be caused by their EPR effect, while can reduce the toxicity of non-target tissue. The results therefore confirmed the conclusion of the cytotoxicity test.
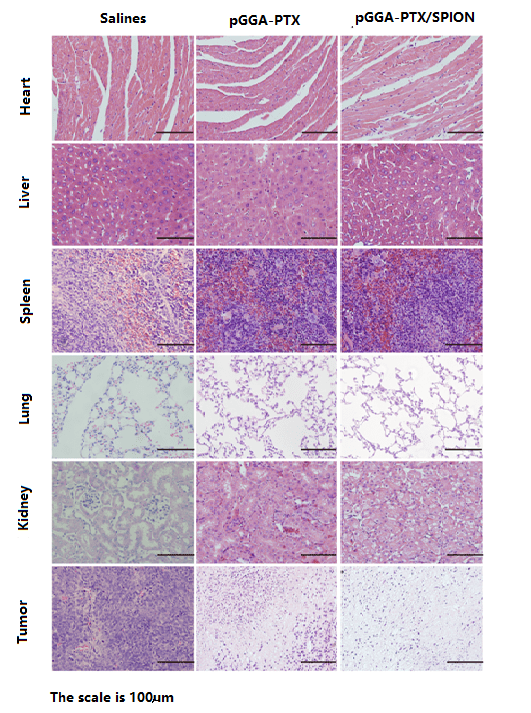
Figure 7: Images of frozen section of normal tissues and tumor after H & E staining. The mice were received a tail vein injection of the certain amount of the pGGA-PTX (middle column) and pGGA-PTX/SPION (right column), respectively as well as (left column) for the control group (the mice were only received a tail vein injection of the same amount of saline)
IX MRI imaging for nude mice inoculated U87 cell
imaging, MRI imaging experiments of living animals were performed. The expression of pGGA-PTX / SPION in the tumor was observed after tail vein injection of pGGA-PTX / SPION at 0h, 0.5h, 1h, 2h, 4h, 12h, 24h and 48h, respectively. It can be observed in (Figure 8) that T2 signal was not detected in the tumor when pGGA-PTX / SPION was just injected into the tail, indicating that pGGA-PTX / SPION did not reach the tumor site. After 0.5 h of injection, a little of the dark can be observed in the tumor. After 4h, T2 signal reached maximum, indicating that the maximum accumulation of pGGA-PTX / SPION in the tumor. From the 4h to 48h, the tumor gradually brightened, indicating that the drug metabolism in the tumor until finished. After 48h from this experiment we can find that, due to the existence of SPION, it is more easily grasp whether the drug gathered in the target site and real-time monitoring of drug content in the tumor and metabolic situation [42].
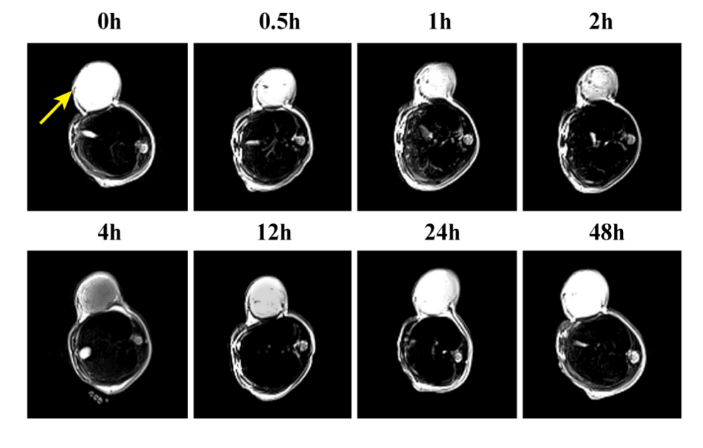
Figure 8: Photographs of MRI for vivo animal inoculated U87 cell with the time from a tail vein injection of concentration 1.5mg/ml of the pGGA-PTX/SPION.
Photographs of MRI for vivo animal inoculated U87 cell with the time from a tail vein injection of concentration 1.5mg/ml of the pGGA-PTX/SPION
Fig. 9 is the experimental results of treatment effects of pGGA-PTX / SPION in vivo, i.e. the volume changes of the tumor with time from tail vein injection of the 1.5mg/ml of the pGGA-PTX, pGGA-PTX / SPION and saline, respectively. After 2 weeks later, we can see from the picture that the volume of the tumor is about 3700 mm3 for the control group, 2500 mm3 for the pGGA-PTX and 1500 mm3 for the pGGA-PTX / SPION. The results showed that pGGA-PTX / SPION and pGGA-PTX had an inhibitory effect on the tumor compared with the control group, and the pGGA-PTX / SPION suppression effect is better. This may be because that iron has the function of activating macrophages which eliminate cancer cells. Only in the presence of macrophages in vivo, the cellular level has no effect. It can be stated that in the body environment, iron has an introduction effect on tumor inhibition. So, from the animal level, pGGA-PTX / SPION on the inhibition of the tumor is a very valuable thing.
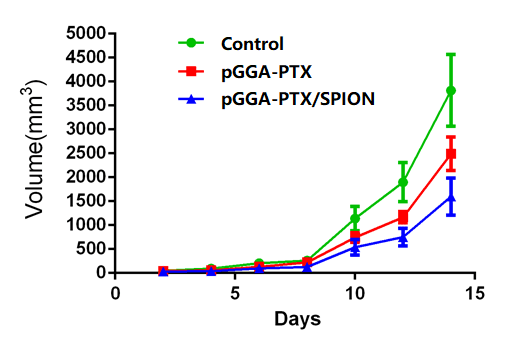
Figure 9: The volume changes of the tumor with the time from tail vein injection of the1.5mg/ml of the pGGA-PTX, pGGA-PTX / SPION and saline, respectively.
Conclusion
A novel theranostics nanoparticles, pGGA-PTX / SPION with a good diagnosis and treatment function has been fabricated. It is plump and uniform in size, about 113.0 ± 0.6 nm, leading to the passive targeting of tumor tissue due to the EPR effect. The content-loaded of PTX was about 27.66% and the contrast agent content was about 6.34%. In vitro evaluation such as cell viability, the pGGA-PTX / SPION NPs were similar to that of PTX, suggesting a useful anticancer effect on tumor cells. In the H&E experiment, the pGGA-PTX / SPION did not impair the normal tissue, which fully proved its safety performance. In vivo imaging, the pGGA-PTX / SPION in the tumor body can clearly be observed by NMR, to achieve real-time monitoring of drugs. In vivo treatment effects experiment, the pGGA-PTX / SPION exhibits a significant tumor growth inhibition effect.
Acknowledgments
The project is supported by National Natural Science Foundation of China (60976004, 61076070) and the Shanghai Municipal Commission of Science and Technology (11JC1403800).
Conflicts of interest
There are no conflicts to declare.
Article Info
Article Type
Research ArticlePublication history
Received: Wed 10, Oct 2018Accepted: Fri 02, Nov 2018
Published: Mon 05, Nov 2018
Copyright
© 2023 Yiting Wang. This is an open-access article distributed under the terms of the Creative Commons Attribution License, which permits unrestricted use, distribution, and reproduction in any medium, provided the original author and source are credited. Hosting by Science Repository.DOI: 10.31487/j.RDI.2018.10.06
Author Info
Corresponding Author
Yiting WangInstitute of Biomedical Engineering and Technology, Shanghai Engineering Research Center of Molecular Therapeutics and New Drug Development, School of Chemistry and Molecular Engineering, East China Normal University
Figures & Tables
Table 1: Size, PDI, ξ potential, and LE of three NPs: SPION, pGGA-PTX and pGGA-PTX/ SPION.
|
Sample |
SPION |
pGGA-PTX |
pGGA-PTX/SPION |
|
size(nm) |
8.02±1.07 |
66.62±1.36 |
113.03±0.6 |
|
PDI |
0.22 |
0.21 |
0.17 |
|
ξ potential(mV)±SD |
-12.04±1.06 |
-30.00±2.00 |
-25.33±3.06 |
|
PTX LC (%) ± SD |
|
35.6 |
27.66 |
|
SPION LE (%) ± SD |
|
|
51.61±4.99 |
|
SPION LC (%) ± SD |
|
|
6.34±0.62 |
References
1. Blay JY, Lacombe D, Meunier F, Stupp R (2012) Personalised medicine in oncology: questions for the next 20 years. Lancet Oncol 13: 448-449. [Crossref]
2. Diamandis M, White NM, Yousef GM (2010) Personalized medicine: marking a new epoch in cancer patient management. Mol Cancer Res 8: 1175-1187. [Crossref]
3. Kalia M (2013) Personalized oncology: recent advances and future challenges. Metabolism 1: 11-14. [Crossref]
4. Ryu JH, Lee S, Son S, Kim SH, Leary JF, et al. (2014) Theranostic nanoparticles for future personalized medicine. J Control Release 190: 477-484. [Crossref]
5. Krasia-Christoforou T, Georgiou TK (2013) Polymeric theranostics: using polymer-based systems for simultaneous imaging and therapy. Journal of Materials Chemistry 1: 3002.
6. Costa Lima SA, Gaspar A, Reis S, Duraes L (2017) Multifunctional nanospheres for co-delivery of methotrexate and mild hyperthermia to colon cancer cells. Materials science & engineering C, Materials for biological applications 75: 1420-1426.
7. Liang X, Fang L, Li X, Zhang X, Wang F (2017) Activatable near infrared dye conjugated hyaluronic acid based nanoparticles as a targeted theranostic agent for enhanced fluorescence/CT/photoacoustic imaging guided photothermal therapy. Biomaterials 132: 72-84. [Crossref]
8. Singh M, Harris-Birtill DC, Markar SR, Hanna GB, Elson DS (2015) Application of gold nanoparticles for gastrointestinal cancer theranostics: A systematic review. Nanomedicine 11: 2083-2098. [Crossref]
9. Zhou L, Yang T, Wang J, Wang Q, Lv X, et al. (2017) Size-Tunable Gd2O3@Albumin Nanoparticles Conjugating Chlorin e6 for Magnetic Resonance Imaging-Guided Photo-Induced Therapy. Theranostics 7: 764-774. [Crossref]
10. Jing Wang, Qilong Li, JingE. Zhou, Yiting Wang, et al. (2017) Synthesis, characterization and cells and tissues imaging of carbon quantum dots, Optical Materials, 72: 15-19.
11. Ivana Martinić, Svetlana V. Eliseeva, Stéphane Petoud (2017) Near-infrared emitting probes for biological imaging: Organic fluorophores, quantum dots, fluorescent proteins, lanthanide(III) complexes and nanomaterials, Journal of Luminescence 189: 19-43.
12. Seung Yoo Choi, Seung Hoon Baek, Sung-Jin Chang, Yohan Song, Tae Jung Park, Synthesis of upconversion nanoparticles conjugated with graphene oxide quantum dots and their use against cancer cell imaging and photodynamic therapy, Biosensors and Bioelectronics, 2017, 267-273
13. Patitsa M, Karathanou K, Kanaki Z, Tzioga L, Pippa N, et al. (2017) Magnetic nanoparticles coated with polyarabic acid demonstrate enhanced drug delivery and imaging properties for cancer theranostic applications. Scientific reports 7: 775.
14. Cho M, Cervadoro A, Ramirez MR, Stigliano C, Brazdeikis A, et al. (2017) Assembly of Iron Oxide Nanocubes for Enhanced Cancer Hyperthermia and Magnetic Resonance Imaging. Nanomaterials (Basel) 7: 72. [Crossref]
15. Shiraishi K, Wang Z, Kokuryo D, Aoki I, Yokoyama M (2017) A polymeric micelle magnetic resonance imaging (MRI) contrast agent reveals blood–brain barrier (BBB) permeability for macromolecules in cerebral ischemia-reperfusion injury. J Control Release 253: 165-171. [Crossref]
16. El-Hammadi MM, Arias JL (2015) Iron oxide-based multifunctional nanoparticulate systems for biomedical applications: a patent review (2008 - present). Expert Opin Ther Pat 25: 691-709. [Crossref]
17. Gobbo OL, Sjaastad K, Radomski MW, Volkov Y, Prina-Mello A (2015) Magnetic Nanoparticles in Cancer Theranostics. Theranostics 5: 1249-1263. [Crossref]
18. Hajba L, Guttman A (2016) The use of magnetic nanoparticles in cancer theranostics: Toward handheld diagnostic devices. Biotechnol Adv 34: 354-361. [Crossref]
19. Hijnen N, Langereis S, Grull H (2014) Magnetic resonance guided high-intensity focused ultrasound for image-guided temperature-induced drug delivery. Adv Drug Deliv Rev 72: 65-81. [Crossref]
20. Timon Hussain, Quyen T. Nguyen (2014) Molecular imaging for cancer diagnosis and surgery. Adv Drug Deliv Rev 66: 90-100. [Crossref]
21. Kozissnik B, Bohorquez AC, Dobson J, Rinaldi C (2013) Magnetic fluid hyperthermia: advances, challenges, and opportunity. Int J Hyperthermia 29: 706-714. [Crossref]
22. Oliveira H, Perez-Andres E, Thevenot J, Sandre O, Berra E, et al. (2013) Magnetic field triggered drug release from polymersomes for cancer therapeutics. J Control Release 169: 165-170. [Crossref]
23. Santhosh PB, Ulrih NP (2013) Multifunctional superparamagnetic iron oxide nanoparticles: promising tools in cancer theranostics. Cancer Lett 336: 8-17. [Crossref]
24. Shete PB, Patil RM, Ningthoujam RS, Ghosh SJ, Pawar SH (2013) Magnetic core–shell structures for magnetic fluid hyperthermia therapy application. New Journal of Chemistry 37: 3784.
25. Zhang L, Dong WF, Sun HB (2013) Multifunctional superparamagnetic iron oxide nanoparticles: design, synthesis and biomedical photonic applications. Nanoscale 5: 7664-7684. [Crossref]
26. Zhu L, Wang D, Wei X, Zhu X, Li J, et al. (2013) Multifunctional pH-sensitive superparamagnetic iron-oxide nanocomposites for targeted drug delivery and MR imaging. J Control Release 169: 228-238. [Crossref]
27. Gullapalli RP, Mazzitelli CL, et al. (2015) Polyethylene glycols in oral and parenteral formulations—A critical review. Int J Pharm 496: 219-239. [Crossref]
28. Mehvar R (2000) Dextrans for targeted and sustained delivery of therapeutic and imaging agents. J Control Release 69: 1-25. [Crossref]
29. Yang H, Chen Y, Chen Z, Geng Y, Xie X, et al. (2017) Chemo-photodynamic combined gene therapy and dual-modal cancer imaging achieved by pH-responsive alginate/chitosan multilayer-modified magnetic mesoporous silica nanocomposites. Biomater Sci 5: 1001-1013. [Crossref]
30. Pandey AP, Sawant KK (2016) Polyethylenimine: A versatile, multifunctional non-viral vector for nucleic acid delivery. Mater Sci Eng C Mater Biol Appl 68: 904-918. [Crossref]
31. Rudra Pratap Singh, H.V. Gangadharappa, K. Mruthunjaya (2017) Phospholipids: Unique carriers for drug delivery systems. Journal of Drug Delivery Science and Technology 39: 166-179.
32. Sun Y, Cao L, Sheng X, Chen J, Zhou Y, et al. (2017) WDR79 promotes the proliferation of non-small cell lung cancer cells via USP7-mediated regulation of the Mdm2-p53 pathway. Cell Death Dis 8: e2743. [Crossref]
33. Wen G, Qu XX, Wang D, Chen XX, Tian XC, et al. (2016) Recent advances in design, synthesis and bioactivity of paclitaxel-mimics. Fitoterapia, 110: 26-37. [Crossref]
34. Dah-Shyong Yu, Hui-Yu Yan, Chia-Lun Wu, Shun-Hsing Hung (2016) Comparison of therapeutic efficacy of lipo-doxorubicin and doxorubicin in treating bladder cancer. Urological Science.
35. Yin J, Niu Y, Shao B (2017) Products of methotrexate during chlorination. J Environ Sci (China) 55: 100-108. [Crossref]
36. Suthiwangcharoen N, Nagarajan R (2017) Nanoarmoring of Proteins by Conjugation to Block Copolymer Micelles. Methods Enzymol 590: 277-304. [Crossref]
37. Tran TT, Tran PH, Yoon TJ, Lee BJ (2017) Fattigation-platform theranostic nanoparticles for cancer therapy. Mater Sci Eng C Mater Biol Appl 75: 1161-1167. [Crossref]
38. Wright N, Rida PCG, Aneja R (2017) Tackling intra- and inter-tumor heterogeneity to combat triple negative breast cancer. Front Biosci (Landmark Ed) 22: 1549-1580. [Crossref]
39. Zheng M, Zhao P, Luo Z, Gong P, Zhang P, et al. (2014) The application of nanotechnology in cancer theranostics. Chinese Science Bulletin (Chinese Version) 59: 3009.
40. Van S, Das SK, Wang X, Feng Z, Jin Y, et al. (2010) Synthesis, characterization, and biological evaluation of poly(L-γ-glutamyl-glutamine)-paclitaxel nanoconjugate. Int J Nanomedicine 5: 825–837. [Crossref]
41. Pearce AK, Rolfe BE, Russell PJ, Tse BWC, Whittaker AK, et al. (2014) Development of a polymer theranostic for prostate cancer. Polym Chem 5: 6932-6942.
42. Singh M, Harris-Birtill DC, Markar SR, Hanna GB, Elson DS (2015) Application of gold nanoparticles for gastrointestinal cancer theranostics: A systematic review. Nanomedicine 11: 2083-2098. [Crossref]