Journals
A New Opportunistic Bone Density Screening Method Based on Colored CT Images of the Spine
A B S T R A C T
More than 60 million computed tomography (CT) exams are performed annually in the United States that include bone density information. There is a need for a practical, passive, accurate, reproducible, and rapid method to perform opportunistic screening of abnormal spinal bone density on routine CT images obtained for other purposes. In this short communication, a novel colorization method to further utilize CT exams for opportunistic bone density screening is reviewed. The colors green and red are applied to rapidly and accurately differentiate normal from abnormal bone density. The study design, results, perspectives, limitations and conclusion of a recently published multi-reader retrospective study are presented.
Keywords
Opportunistic bone density, computed tomography, color enhanced detection
I N T R O D U C T I O N
Osteoporosis is a common, chronic disease of the bone that is clinically silent, and the first sign of the disease process is often a fracture. More than 50 million Americans are affected by osteoporosis with nearly two million fractures diagnosed annually, costing the American healthcare system nearly $20 billion [1]. Moreover, 1 in 2 postmenopausal women and 1 in 5 men greater than the age of 60 have osteoporosis, and 50% of patients diagnosed with an osteoporotic-related fracture never underwent bone density screening [2, 3]. The barriers to successful diagnosis and management of osteoporosis include lack of appropriate screening tests, lack of patient education, and the fact that clinical practice guidelines are of variable quality with different recommendations [4, 5]. The preferred methods to assess bone density, Dual-Energy X-ray absorptiometry (DXA) and Quantitative Computed Tomography (QCT), are accurate but underutilized [6]. Emerging evidence supports the use of routine Computed Tomography (CT) scans as an alternative for opportunistic screening for abnormal bone density [7-10].
With more than 60 million CT exams conducted annually in the United States that include bone density information, a practical, accurate and rapid method for extracting this information is lacking. As pointed out within the article by Smith et al., current methods for opportunistic screening consist of subjective visual assessment of grayscale CT images and quantitative measurements of vertebral mean attenuation in Hounsfield Units (HU) [7]. Smith et al. propose a novel colorization method to further utilize CT exams obtained for other purposes for opportunistic bone density screening [7]. Using custom offline image processing software, Color Enhanced Detection (CED) software, the authors converted grayscale thin slice nonenhanced CT (NECT) axial images into a colored thick slab (20 mm) sagittal image of the central aspect of the spine (Figure 1). The colors green and red are applied to rapidly and accurately differentiate normal from abnormal bone density, respectively.
Attenuation Cut-Point
Smith et al. conducted a retrospective single center observational study [7]. In order to obtain the optimal vertebral body mean attenuation coefficient for differentiating normal from abnormal bone density, mean attenuation (HU) of the trabecular bone of the L3 and L4 vertebral bodies was associated with mean bone density (g/cm3) in a training cohort (N = 511). The reference standard for bone density was per QCT with a bone density phantom. Normal bone density was defined as ≥120 g/cm3, and abnormal bone density (low and osteoporotic bone) was defined as <120 g/cm3. The authors found that bone density and mean attenuation were highly correlated (r = 0.95/0.94, p < 0.001 for both L3 and L4), and a bone density of 120 g/cm3 corresponded to an optimal attenuation cut point of 145 HU. The information was useful for generating the colored CT images. The CED software was designed to straighten the spine and generate a thick slab (20 mm) and smoothed sagittal reconstruction image of the central aspect of the spine. As vertebral body trabecular bone density is heterogeneous, a thick slab was generated to intentionally increase volume averaging in the right to left direction, and smoothing algorithms were used to intentionally increase volume averaging in the anterior to posterior and superior to inferior directions, to better approximate the average trabecular bone attenuation/density. The image was then colored, with normal bone density (≥145 HU) colored green and abnormal bone density (>40 to <145 HU) colored red.
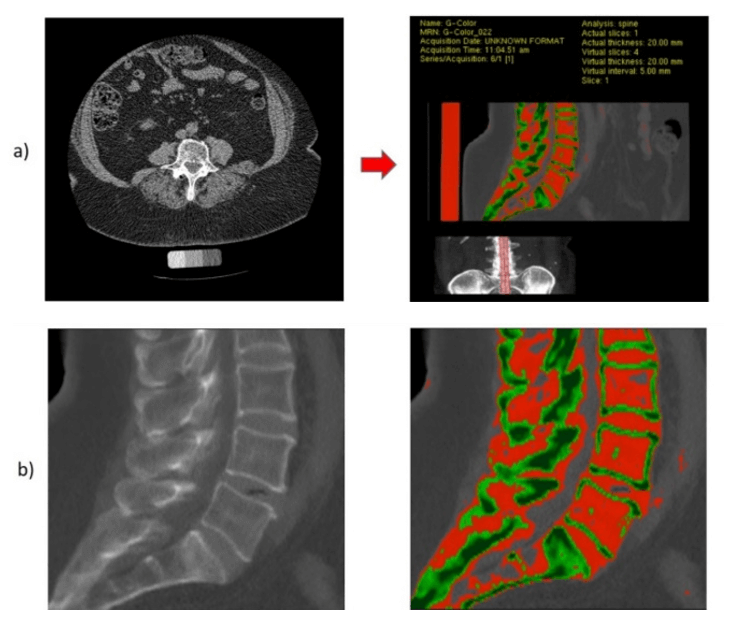
Figure 1: Conversion of routine axial abdominal CT images to colored image using Color Enhanced Detection Software (a). Thick slab (20 mm) grayscale and colored images of the center of the spine are exported, with red color in the trabecular bone indicating abnormal bone density (b).
Multi-Reader Validation
In order to validate the CED software and colored images as a practical, accurate and rapid method to assess bone density, CT images from a separate cohort of 120 randomly selected participants were assessed by multiple readers. Five radiologists independently assessed bone mineral density at L3 and L4 using 1) QCT, 2) subjective grayscale visual assessment of sagittal images (Grayscale), 3) quantitative attenuation measurements of the center of the spine using sagittal images (Attenuation), and 4) subjective visual assessment of colored sagittal images (Color; Figure 2). The mean bone density using the QCT method served as the reference standard. The accuracy of Color, Attenuation and Grayscale methods was 91%, 87% and 58% (p<0.001). Inter-observer agreement was excellent for Color (ICC:0.87) and Attenuation methods (ICC:0.85) but poor for the Grayscale method (ICC:0.20). Under optimal conditions for each method, the average time of assessment for Color, Attenuation, and Grayscale methods was 2.0, 12.9, and 8.4 seconds (p<0.001). In summary, subjective visual assessment of colored CT images had the highest accuracy, highest inter-observer agreement, and was the most rapid method, outperforming both mean attenuation measurements and subjective visual assessment of grayscale CT images.
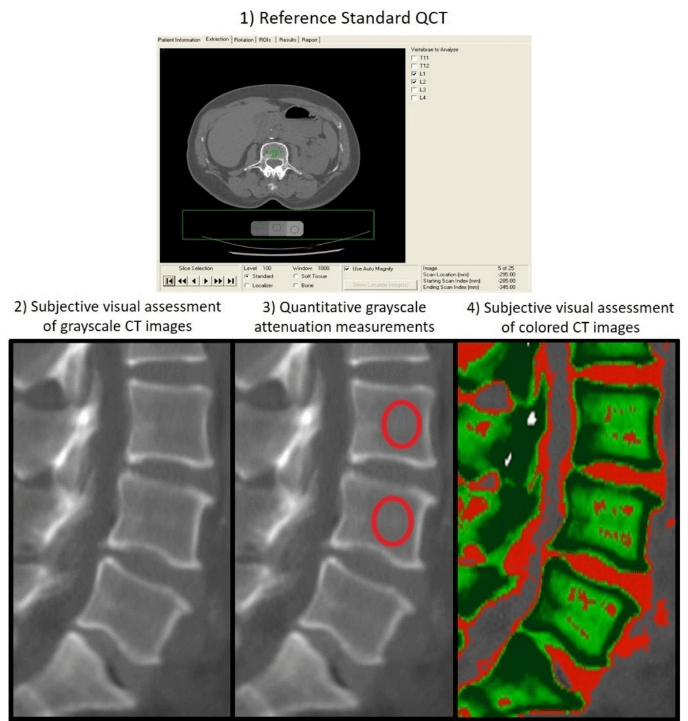
Figure 2: Five expert radiologists conducted 4 independently timed assessments of bone density at L3 and L4 using 1) Quantitative Computed Tomography (reference standard) 2) subjective grayscale visual assessment of sagittal images (Grayscale), 3) quantitative attenuation measurements of the center of the spine using sagittal images (Attenuation), and 4) subjective visual assessment of colored sagittal images (Color). All reading sessions were separated by >2 weeks to minimize recall bias. The example patient shown has normal bone density (predominantly green in the trabecular portion of the bone on the colored images).
Perspective
The ideal method for opportunistic screening of abnormal spinal bone density on routine CT images should be practical, passive, accurate, reproducible among different readers, and rapid. Current efforts of opportunistic screening continue to be underutilized despite high morbidity, mortality, and cost burden of osteoporosis. Smith et al. demonstrated that colored sagittal CT images are potentially an ideal method for opportunistic screening of abnormal bone density as their method requires minimal effort and training to perform, is cost efficient, and is highly accurate in detecting abnormal bone density. While the authors focused on differentiation of normal from abnormal bone density (osteoporosis and low bone density), the technique could be performed with one or more different attenuation thresholds to increase sensitivity or specificity or to target screening of osteoporosis from low and normal bone density. Color Enhanced Detection software was used to process routine axial CT images to generate color thick slab (20 mm) sagittal images. This is a relatively simple image reconstruction algorithm that could be fully automated and incorporated into a CT scanner console, image workstation, server, cloud-based image processing system, thin-client image processing system, or picture archiving and communication system (PACS). The image processing algorithm is vendor neutral and could be adapted to chest, abdomen or spinal images from any CT scanner manufacturer or model, which could markedly increase opportunistic bone density screening efforts if widely deployed.
Limitations
The study by Smith et al. has several limitations. The study was retrospective in design, which is appropriate for a pilot study. The study cohort included only African Americans, limiting generalizability of the results. This particular cohort included men and women of various ages, all of whom had a QCT phantom in place. The authors also focused assessment on the L3 and L4 vertebrae because this cohort only had imaging of this portion of the lumbar spine. The study did not assess repeatability across different image acquisition parameters, reproducibility across different CT scanners, or the effect of intravenous contrast on interpretation. Of note, this was only a pilot study, and the authors have recently completed a prospective study in women >50 years of age presenting for screening mammography (N=200), focusing on bone density assessment at L1 and L2. The results of this study validated the results of their pilot study and are pending publication.
Conclusion
The use of image post-processing software to convert routine axial CT images of the abdomen into colored sagittal images was highly accurate, had very good inter-observer agreement, and was an extremely rapid method to differentiate normal from abnormal spinal bone density. The technique is conceivably applicable to images from any CT scanner manufacturer and model. With automation of the image processing, the Color Enhanced Detection software has the potential to improve screening efforts to identify low bone density or osteoporosis in both men and women with routine CT images of the chest, abdomen or spine, at no additional cost or radiation exposure for patients.
Abbreviations
DXA – dual-energy X-ray absorptiometry
QCT – quantitative computed tomography
CT – computed tomography
HU – Hounsfield Units
CED – Color Enhanced Detection
NECT – non-enhanced computed tomography
mm – millimeters
g – grams
cm3 – cubic centimeters
ICC – intra-class correlation coefficient
PACS – Picture Archiving and Communication System
Article Info
Article Type
Short CommunicationPublication history
Received: Wed 03, Apr 2019Accepted: Mon 22, Apr 2019
Published: Fri 03, May 2019
Copyright
© 2023 Elliot Varney. This is an open-access article distributed under the terms of the Creative Commons Attribution License, which permits unrestricted use, distribution, and reproduction in any medium, provided the original author and source are credited. Hosting by Science Repository.DOI: 10.31487/j.RDI.2019.02.02
Author Info
Corresponding Author
Elliot VarneyDepartment of Radiology, University of Mississippi Medical Center, 2500 N State St., Jackson, MS 39216, USA
Figures & Tables
References
- U.S. Preventative Services Task Force (2011) Screening for osteoporosis: U.S. preventative services task force recommendation statement. Ann Intern Med 154: 356-364. [Crossref]
- F Cosman, SJ de Beur, MS LeBoff, EM Lewiecki, B Tanner et al. (2014) Clinician’s Guide to Prevention and Treatment of Osteoporosis. Osteoporosis Int 25: 2359-2381. [Crossref]
- Raisz LG (2005) Clinical practice. Screening for osteoporosis. N Engl J Med 353: 164-171. [Crossref]
- Patel D, Worley JR, Volgas DA, Crist BD (2018) The effectiveness of Osteoporosis Screening and Treatment in the Midwest. Geriatr Orthop Surg Rehabil 9: 2151459318765844. [Crossref]
- Hayawi LM, Graham ID, Tugwell P, Yousef Abdelrazeq S (2018) Screening for osteoporosis: A systematic assessment of the quality and content of clinical practice guidelines, using the AGREE II instrument and the IOM Standards for Trustworthy Guidelines. PLoS One 13: e0208251. [Crossref]
- Brett AD, Brown JK (2015) Quantitative computed tomography and opportunistic bone density screening by dual use of computed tomography scans. J Orthop Translat 3: 178-184. [Crossref]
- Smith A, Khan M, Varney E, Liu B, Roda M et al. (2019) Opportunistic bone density screening for the abdominal radiologist using colored CT images: pilot retrospective study. Abdom Radiol (NY) 44: 775-782. [Crossref]
- Pickhardt PJ, Pooler BD, Lauder T, del Rio AM, Bruce RJ et al. (2013) Opportunistic screening for osteoporosis using abdominal computed tomography scans obtained for other indications. Ann Intern Med 158: 588-595. [Crossref]
- Lenchik L, Weaver AA, Ward RJ, Boone JM, Boutin RD (2018) Opportunistic screening for Osteoporosis Using Computed Tomography: State of the Art and Argument for Paradigm Shift. Curr Rheumatol Rep 20: 74. [Crossref]
- Pickhardt PJ, Lee SJ, Liu J, Yao J, Lay N et al. (2019) Population-based opportunistic osteoporosis screening: Validation of a fully automated CT tool for assessing longitudinal BMD changes. Br J Radiol 92: 20180726. [Crossref]