A Natural History Study of VCP Associated Vacuolar Myopathy in a Patient with the Common R155H Mutation
A B S T R A C T
Background: IBMPFD (Inclusion Body Myopathy associated with Paget disease of the bone and Frontotemporal Dementia) is an autosomal dominant inherited disease caused by VCP gene mutations. Very little natural history data exists on this disease. We report a patient with a significant family history of IBMPFD associated with the common R155H mutation in the VCP gene.
Objective: This study will address the lack of long-term data for muscle strength, and respiratory function in IBMPFD. The hypothesis is that detailed analysis in a single patient will provide meaningful natural history data in IBMPFD, a progressive neurodegenerative disease.
Method: Regression analysis was performed across multiple parameters related to myopathy including dynamometry, MRC scale, IBM functional rating scale, pulmonary function studies and sleep quality.
Results: Measurements of this patient highlight progressive generalized weakness in proximal and distal regions, decline in pulmonary function, and asymmetrical strength differences of the upper extremities. Measurements over five years revealed an overall deterioration with a slope of -1.13 and R2 value of 0.77.
Conclusion: This unique data derived from long-term evaluations in a patient provides the first report of the rate of progression of muscle weakness and pulmonary function deterioration in VCP associated inclusion body myopathy.
Keywords
VCP, R155H, IBMPFD, vacuolar myopathy, natural history inclusion, body myopathy, DEXA, dynamometry, IBMFRS
Introduction
IBMPFD (Inclusion Body Myopathy associated with Paget disease of the bone and Frontotemporal Dementia) is an autosomal dominant disease caused by mutations in the VCP gene. IBM is clinically diagnosed in 90% of patients at a mean age of onset of 45 years [1, 2]. Paget disease of the bone (PDB) is seen in 42% of patients at a mean age of 35 years [3]. Frontotemporal dementia which occurs at a mean age of 55 years in 30% of IBMPFD patients often results in early death; however, those with myopathy may have several decades of increasing weakness and loss of mobility. IBMPFD is highly penetrant and is typically considered if two or more of the typical features or suggestive family history is present [4]. There is currently a lack of information on the long-term progression of this disease. We performed regression analysis of many parameters of muscle strength, function, and pulmonary function studies in one patient which provides a preliminary model on the rate of progression in this disease. Evaluation of rate of progression helps patients plan when assistive devices will be required and also provides the framework to evaluate future treatments that have the potential to impact the course of the disease.
Methods
This study was approved by the University of California, Irvine IRB. Informed consent for this study was obtained. The tests were performed at the ICTS (Institute of Clinical Translational Science), University of California, Irvine. Multiple parameters were measured over several visits.
I IBMFRS Scale
The IBMFRS quantifies functional levels of common tasks on a 4-point scale for patients with inclusion body myositis. It is effective at indicating the severity of myopathy [5]. The survey was administered to the patient over seven visits between age 62 and 67.
II Medical Research Council Scale (MRC)
The MRC is a reliable and validated 5-point muscle scale developed by the Medical Research Council that quantitatively assesses muscle contraction for various proximal and distal muscle groups [6]. Measurements using a microFET® 2 dynamometer were taken between age 62 and 69 to assess muscle strength changes.
III Grip Strength Dynamometry
Grip strength measurements using the Jamar handheld dynamometer (Patterson Medical) was obtained at five time points at UC Irvine Institute of Clinical Translational Science (ICTS), and at weekly intervals by the patient using a Camry® EH101 electronic hand dynamometer. Dynamometry is an effective for assessing isometric limb strength and is correlated with the IBMFRS scale [4, 7].
IV Sleep Duration/Disruptions
In diseases such as ALS and Pompe disease presenting with muscle weakness including diaphragmatic weakness, sleep quality was expected to be affected and was therefore assessed [8, 9]. The patient recorded sleep duration and disruptions with a ©Fitbit to assess sleep quality which reflect daily life changes. Measurements were taken for 6 years.
V Pulmonary Function Tests (PFTs)
Spirometry measurements were performed on the Vmax® Encore PFT system to assess pulmonary condition over five visits between ages 62 and 69 years. The variables measured were forced expiratory volume (FEV1), forced vital capacity (FVC), maximum inspiratory pressure (MIP) and maximum expiratory pressure (MEP). PFTs reflect airway resistance and are effective at detecting obstructive ventilatory defect and restrictive lung defect [10].
VI Dual-Energy X-ray Absorptiometry (DEXA)
DEXA scans measuring bone mineral density, fat mass and lean mass were taken over 5 clinical visits between ages 62 and 69. DEXA measurements supplement muscle strength analysis because changes in lean mass can indicate severity of myopathy. T scores represent standard deviations in bone mineral density. T scores between 1 and -1 represent normal range, whereas individuals with T scores between -1 and -2.5 are at risk for osteopenia and fractures. T scores less than -2.5 are at risk for osteoporosis [11].
VII Magnetic Resonance Imaging of Thighs
MRI T2 scans of the thighs were taken at age 62 to visually assess myopathy condition. T2 images are sensitive to increases in water and fat volume. In diseases presenting muscle loss such as ALS, MRI is a good indicator of muscle volume [12].
VIII Statistical Analysis
Long term changes of multiple clinical parameters were analyzed with linear regression, using ©Microsoft Excel. Slopes and correlation coefficients were recorded. This statistical approach provides a model for muscle deterioration in IBMPFD over a course of several years. A t-test was performed to determine if there was a significant difference in myopathy severity between left and right upper extremity muscles.
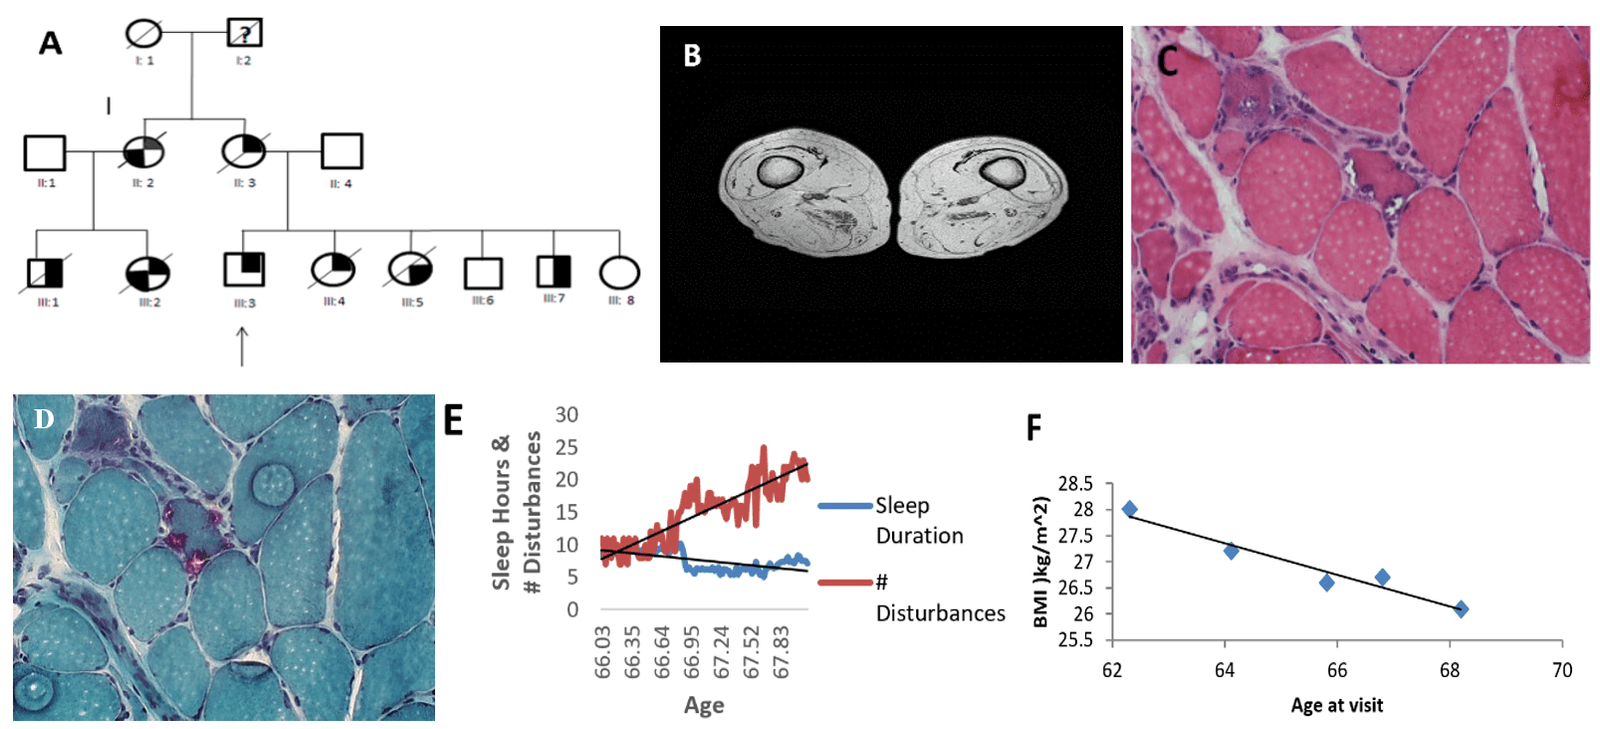
Figure 1: Clinical and Lifestyle Data. A) Pedigree. The patient is represented by symbol III:3. The filled in top right corner of a symbol represents myopathy, the bottom right corner represents Paget disease of the bone, and the bottom left corner represents frontotemporal dementia. The slash mark indicates deceased and the question mark indicates unknown phenotype. Individual II:2 was diagnosed with Alzheimer’s disease and is deceased. Cousin III:1, III:2 and siblings III:4, III:5 are deceased from the familial disease. B) MRI thighs obtained at 62 years. C) H&E stain shows variable dimensions of muscle fibers (diameter 5 – 160 μm). D) Gomori trichrome stain shows rimmed vacuoles (purple). E) Sleep duration/disruptions. Sleep duration follows a linear regression pattern (m=-0.0298, b=9.1347, R² = 0.3784). Sleep disruptions follow a linear regression pattern (m=0.1406, b=7.6267, R²=0.7761). F) BMI decreases as a function of age (m=-0.3032, b=46.763, R²=0.9448)
Results
Case Report
The patient is primarily of Irish ancestry and started experiencing deterioration in his muscle strength in all muscle groups at 33 years. He was diagnosed with VCP inclusion body myopathy at the age of 56 years because of a positive family history of myopathy, and Paget disease of bone. He carries the common c.464G>A mutation p.Arg155His (p.R155H) in the VCP gene.
On review of his family history his mother (II:3) and maternal aunt (II:2) became wheelchair-bound because of myopathy, and the latter developed dementia. His cousins (III:1) and (III:2) also developed myopathy. he has five siblings, three of whom inherited the familial disease from their mother and two of whom are deceased from myopathy (Figure 1A). His sister III:4 developed progressive weakness at age 39 years and had an elevated ALP. His brother III:7 developed weakness in the left shoulder and atrophy in the deltoid muscle during his 20s [3]. His cousins (III:1) and (III:2) also developed myopathy.
Muscle biopsy of right quadriceps muscle at age 54.6 years were studied. H&E and Gomori trichrome stains revealed variable sized muscle fibers with rare necrotic fibers, rimmed vacuoles and angulated and basophilic fibers were also seen (Figures 1C & 1D) [13]. Bone scans at age 62 years indicate no findings typical of Paget’s disease. He has been wheelchair-bound for 12 years and has recently started ventilator support for CO2 retention attributed to his diaphragmatic weakness.
On reviewing his muscle biopsy by light microscopy there were nonspecific changes including fiber size variability and single or multiple rimmed vacuoles.
His BMI linearly decreased as a function of his age (m=-0.3032, b=46.763, R²=0.9448) (Figure 1F). Decreasing BMI may be a good indicator of increasing muscle loss [4]. Magnetic resonance imaging (MRI) of patient’s thighs taken at age 62 years was significant for depletion of muscle mass and replacement with fat (Figure 1B).
I IBMFRS Scale
The maximum IBMFRS score was 24 out of a maximum at age 62 years with a steady decrease in the score over the subsequent 5 years to 15. The minimum score was 12 and occurred at age 64.6. The decrease in IBMFRS scores was weakly correlated with age, following a linear equation of y = -0.0044x + b=198.71 with an correlation coefficient, R2 of 0.5364 (Figure 3F).
II Medical Research Council Scale (MRC Score)
There was a gradual decrease in elbow and wrist MRC flexion and extension over five visits between age 62 and 69 years as seen in (Figure 3A-D). There is a significant difference between left upper extremity and right upper extremity MRC scores (p=0.0029, 1-tailed, paired t-test). MRC scores are higher in the right upper extremity and declined faster (m=-2.0194, b=160.93, R^2=0.7519) than MRC scores of the left upper extremities (m=-1.3619, b=113.91, R^2=0.7565) (Figure 3E).
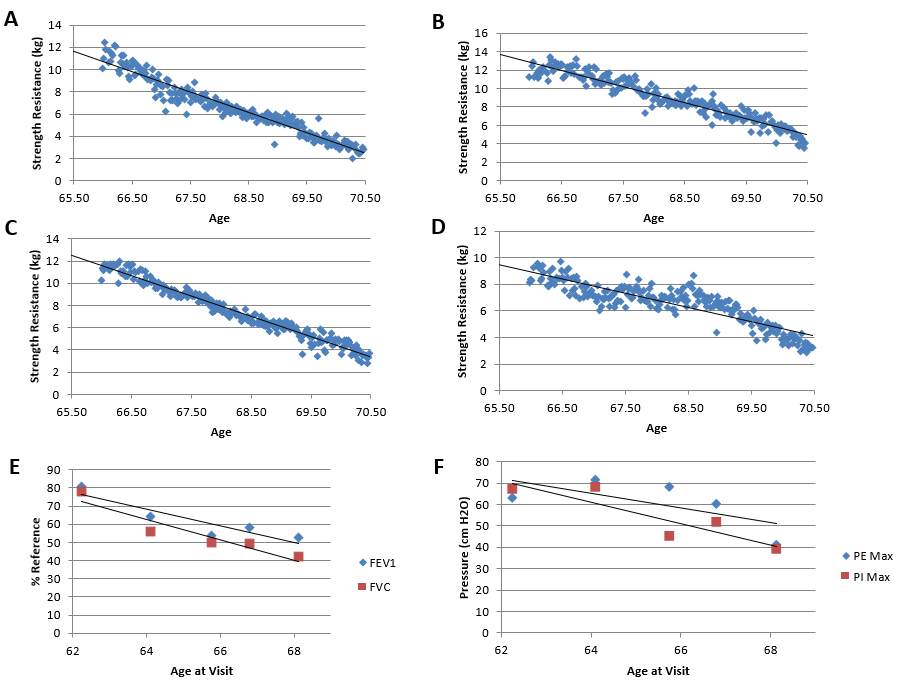
Figure 2: Decline of Muscle strength and Lung function. Dynamometry measurements of general grip, supine grip, and prone grip strength were taken in kilograms. Pulmonary variables were measured over 5 visits. A) Right-hand grip strength follows a linear regression of (m=-1.8366, b=131.96, R² = 0.9374). B) Left-hand grip strength follows a linear regression of (m=-1.7523, b=128.49, R² = 0.9087). C) Prone grip strength follows a linear regression of (m=-1.8338, b=132.6, R² = 0.9623). D) Supine strength follows a linear regression of (m=-1.0653, b=79.255, R²=0.7769). E) FEV1 compared to normal reference values, follows a linear regression of (m=-4.5157, b=357.35, R²=0.8188). FVC follows a linear regression of (m=-5.6498, b=424.52, R²=0.887). F) PEmax follows a linear regression of (m=-3.4454, b=285.93, R²=0.4531). PImax follows a linear regression (m=-5.0183, b=382.42, R²=0.7882)
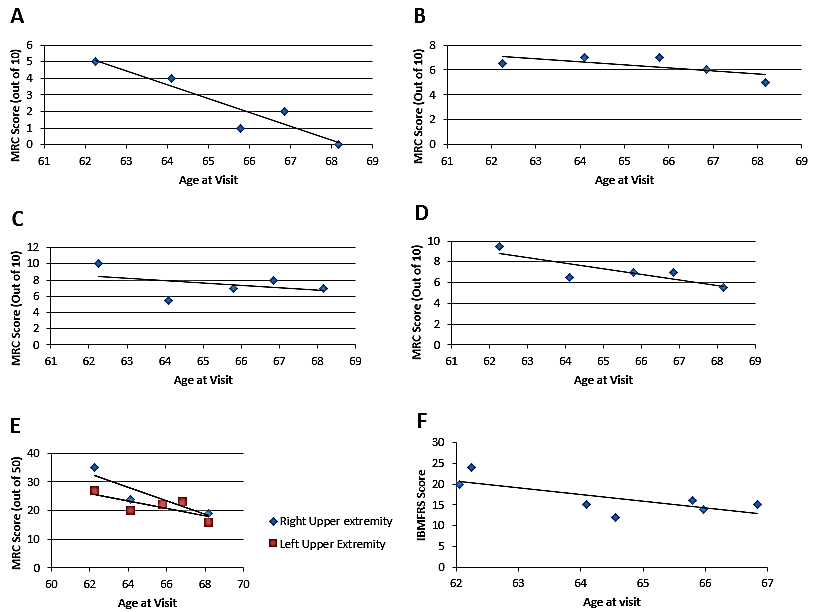
Figure 3: Decline in upper extremity MRC scores and IBMFRS. A) Elbow flexion MRC scores follow a linear regression of (m=-1.6758, b=114.45, R²=0.879). B) Elbow extension MRC scores follow a linear regression of (m=-0.2463, b=23.413, R²=0.4664). C) Wrist flexion MRC scores follow a linear regression of (m=-0.2847, b=26.126, R²=0.1586). D) Wrist extension MRC scores follow a linear regression of (m=-0.4673, b=37.479, R²=0.4396). E) Decline in right and left upper extremity MRC scores. Upper extremity scores include elbow and wrist extension and flexion. MRC scores follow a linear regression of (m=-2.3602, b=179.03, R^2=0.804) for the right side and (m=-1.3121, b=107.45, R^2=0.5686) for the left side. F) IBMFRS scores follow a linear regression of (m=-1.6053, b=120.13, R²=0.5305)
III Dynamometry
There was an overall linear decrease in general grip, supine grip and prone grip strength over time [R² > 0.9 for general and prone grip strength; R² > 0.7 for supine grip strength]. Left supine grip strength slightly increased but was unremarkable [m=6.777E-4, b=7.216, R2 = 0.0650] (Figures 2C & 2D). A steeper decline in grip strength was observed for prone position than supine position. Right hand grip strength showed a visibly steeper decline than left hand grip strength (Figures 2A & 2B).
IV Sleep Duration/Disruptions
A major decrease in sleep duration occurred during week 45. Sleep duration was consistently fluctuating between 6 and 10 hours. Sleep duration decreased after 40 weeks and stayed relatively stable for the remaining weeks of the collection. These variable sleep disruption patterns follow a linear regression of (m=0.1406, b=7.6267, R²=0.7761) (Figure 1E).
V Pulmonary Function Tests
Over the seven-year period of monitoring there was a steady linear decline in pulmonary variables. The FEV1%ref (compared to normal reference) linear equation is [m= -4.5157, b=357.35, R²=0.8188] and the FVC%ref linear equation is [m=-5.6498, b=424.52, R²=0.887] (Figure 2E). The linear equation of PEmax, measured in cm H2O is [m=-3.4454, b=285.93, R²=0.4531]. The PImax linear equation follows a linear regression (m=-5.0183, b=382.42, R²=0.7882) (Figure 2F).
VI Dual-Energy X-ray Absorptiometry (DEXA)
DEXA T-score of the left hip progressed from -1.2 at age 62 years to -1.8 at age 68 years from mild to marked osteopenia (Figure 4A). The BMD values for lumbar spine, and overall body stayed within normal range demonstrating a lack of bone health issues in these regions (Figure 4B). Fat mass demonstrated an inverse relationship with lean mass [m= -1.4232, b= 112651, R² = 0.9686]. As fat mass increased, lean mass and total mass consistently decreased over time. These measurements had strong correlation coefficients (R² >0.9) (Figure 4C-4E).
VII Magnetic Resonance Imaging of Thighs
MRI thighs showing extensive dystrophic fatty infiltration of muscle (Figure 1B).
Discussion
The patient only presents isolated myopathy which is seen in 30% of individuals with IBMPFD [1, 4]. A review of IBMPFD found that many patients experience respiratory and cardiac failure that leads to premature death in their 40s-60s. At the time of the writing of this paper the patient is 70.5 years, which is longer than most patients with VCP disease however he has exhibited respiratory deterioration resulting in his current use of a trilogy ventilator [3, 13, 14]. We analyzed comprehensive long-term functional status using IBMFRS, MRC scales, dynamometry for muscle function in addition to pulmonary function studies and DEXA, the latter for bone mineral, fat and lean muscle mass changes in a patient with VCP associated familial inclusion body myopathy.
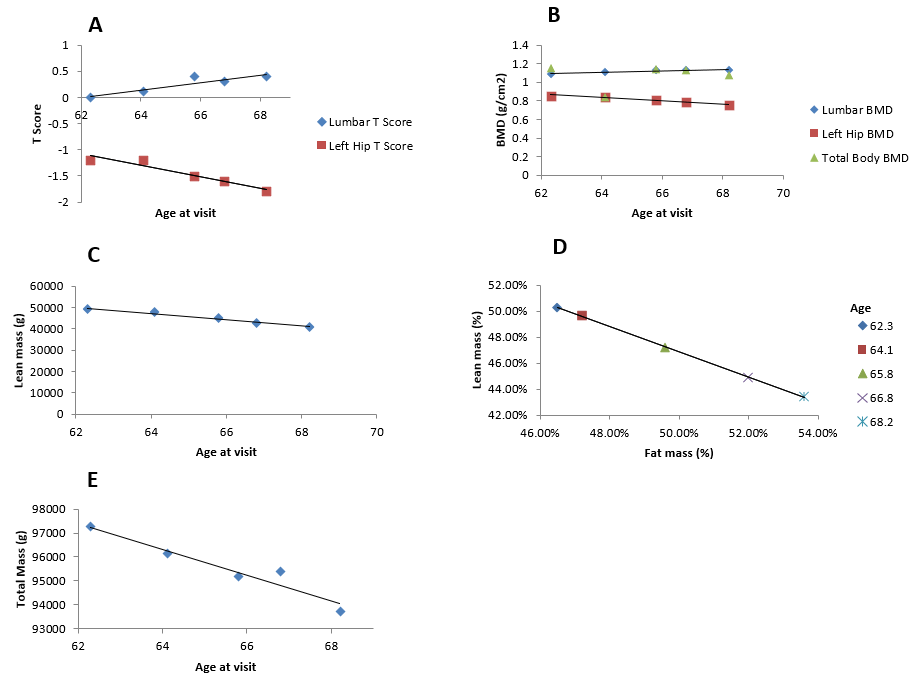
Figure 4: DEXA measurements of bone, fat and muscle mass. A) Lumbar spine (L1-L4) BMD t-score follows a linear regression of (m=0.0716, b=-4.4466, R²=0.8258). Left-hip BMD t-score follows a linear regression of (m=-0.1086, b=5.6469, R²=0.9215). B) Total body BMD follows a linear regression of (m=0.0071, b=0.6025, R²=0.0162). Lumbar spine (L1-L4) BMD follows a linear regression of (m=0.0085, b=0.5603, R²=0.8614). Left-hip BMD follows a linear regression of (m=-0.0175x, b=1.959, R²=0.9592). C) Lean mass follows a linear regression of (m=-3.9451, b=208529, R² = 0.96). D) Lean mass percent decreases as a function of fat mass percent, according to a linear regression of (m=-0.9733, b=0.9553, R²=0.9998). E) Total mass follows a linear regression of (m=-542.18, b=131029, R²=0.9302).
MRC scores decline for older patients with mutations in VCP as was depicted in our patient [4]. Although a recent cross-sectional study of IBMPFD patients reported that there were no significant differences between left and right muscle groups, our patient demonstrated asymmetric muscle weakness of the upper extremities. Asymmetric muscle weakness is common in other neuromuscular diseases such as ALS, Pompe, and IBM [15-17]. In this patient, the right upper extremity MRC scores were consistently higher but degenerated faster than the left upper extremity. The varying degree of muscle degeneration amongst the upper extremity may inherently be due to the heterogeneity of muscle groups. Muscle training may counteract the progression of myopathy, which has implications on increased muscle group use [18]. IBMFRS is an effective method for assessing functional status of myopathy disease severity as also noted previously [4, 19]. Long-term deterioration of myopathy was therefore monitored with these simple tests.
As myopathy progresses to respiratory muscles in IBMPFD, PFTs are useful in monitoring respiratory function following diagnosis as is the case in other disorders such as late onset Pompe disease, ALS, and IBM [7, 20-24]. The general increase in sleep disruptions and remarkable drop in sleep duration over time was noted or will on monitoring him with a Fitbit. In a sleep study evaluating sleep quality and sleep-related respiratory patterns, patients with sporadic IBM (50-80 years of age) also reported significantly more sleep disruptions and had lower sleep efficiency than the general population (78.8+12.0%) [25]. DEXA scans also revealed a gradual inverse relationship between fat mass and lean mass as a consequence of myopathy. Compared to a study with 35 affected individuals, this patient’s BMI is lower than the mean BMI of 30 which may be a reflection of the progressive muscle loss with increasing age (Figure 1F) [4]. Low BMI is also a risk factor for low mineral density in hereditary and sporadic myopathies [26]. Indeed, the patient’s BMD t-scores (relative to an ideal or peak bone mineral density of a healthy 30-year-old adult) The t score changes in the left hip indicate osteopenia or may be indicative of subclinical Paget disease, whereas the slight increase in BMD t scores for Lumbar spine (L1-L4) may be due to vertebral compression related to age-related bone loss of the spine [27].
The overall findings highlight progressive generalized weakness in proximal and distal regions, decline in pulmonary function, and significant asymmetrical strength differences of the upper extremities. Atrophying musculature with the replacement of muscle by fat was evident in biopsy and MRI T2 scans, respectively. These findings support the hypothesis that muscle strength will deteriorate over time. Measurements of this patient over several years revealed an overall deterioration with a slope of -1.13 and R2 value of 0.77. To our knowledge, there are no other publications that provide a long-term regression model of multiple parameters in a patient with VCP disease. We propose that this preliminary model of progression of the myopathy may provide a timeline of when assistive devices are needed and a framework to evaluate future treatments. Our study hopes to promote awareness and understanding of VCP disease in the context of long-term changes in health.
Limitations
A limitation to this study is that the results represent the rate of change in measurements in one patient.
Conclusion
Future studies with a larger patient population would allow validation of this model of rate of progression muscle weakness, and respiratory function in monitoring IBMPFD progression.
Acknowledgements
We acknowledge the patient, his family, and healthcare providers for their contributions. We thank the patient support organizations www.ibmpfd.com and https://www.curevcp.org/. This study was funded by the National Institute of Health (AR050236 VK) and UC Irvine ICTS (Institute of Clinical Translational Science), NCATS (TR001414).
Article Info
Article Type
Case ReportPublication history
Received: Tue 24, Dec 2019Accepted: Tue 14, Jan 2020
Published: Fri 29, May 2020
Copyright
© 2023 Virginia Kimonis. This is an open-access article distributed under the terms of the Creative Commons Attribution License, which permits unrestricted use, distribution, and reproduction in any medium, provided the original author and source are credited. Hosting by Science Repository.DOI: 10.31487/j.CEI.2020.01.01
Figures & Tables
References
- Al-Obeidi E, Al-Tahan S, Surampalli A, Goyal N, Wang A et al. (2018) Genotype-phenotype study in patients with valosin-containing protein mutations associated with multisystem proteinopathy. Clin Genet 93: 119-125. [Crossref]
- Mehta S, Khare M, Ramani R, Watts G, Simon M et al. (2013) Genotype-phenotype studies of VCP-associated inclusion body myopathy with Paget disease of bone and/or frontotemporal dementia. Clin Genet 83: 422-431. [Crossref]
- Kimonis VE, Kovach MJ, Waggoner B, Leal S, Salam A et al. (2000) Clinical and molecular studies in a unique family with autosomal dominant limb-girdle muscular dystrophy and Paget disease of bone. GenetMed 2: 232-241. [Crossref]
- Plewa J, Surampalli A, Wencel M, Milad M, Donkervoort S et al. (2018) A cross-sectional analysis of clinical evaluation in 35 individuals with mutations of the valosin-containing protein gene. Neuromuscul Disord 28: 778-786. [Crossref]
- Jackson C, Barohn R, Gronseth G, Pandya S, Herbelin L (2008) Inclusion body myositis functional rating scale: A reliable and valid measure of disease severity. Muscle Nerve 37: 473-476. [Crossref]
- MRC Muscle Scale - Research - Medical Research Council.
- Kimonis VE, Mehta SG, Fulchiero EC, Thomasova D, Pasquali M et al. (2008) Clinical studies in familial VCP myopathy associated with Paget disease of bone and frontotemporal dementia. Am J Med Genet A 146A: 745-757. [Crossref]
- Lo Coco D, Cannizzaro E, Spataro R, Taiello AC, La Bella V (2012) Sleep–wake problems in patients with amyotrophic lateral sclerosis: implications for patient management. 2: 315-324.
- Aslan GK, Huseyinsinoglu BE, Oflazer P, Gurses N, Kiyan E (2016) Inspiratory Muscle Training in Late-Onset Pompe Disease: The Effects on Pulmonary Function Tests, Quality of Life, and Sleep Quality. Lung 194: 555-561. [Crossref]
- FEV1/FVC ratio (2018).
- Understanding Bone Density Results (2018).
- Bryan WW, Reisch JS, McDonald G, Herbelin LL, Barohn RJ et al. (1998) Magnetic resonance imaging of muscle in amyotrophic lateral sclerosis. Neurology 51: 110-113. [Crossref]
- Hubbers CU, Clemen CS, Kesper K, Boddrich A, Hofmann A et al. (2007) Pathological consequences of VCP mutations on human striated muscle. Brain 130: 381-393. [Crossref]
- Kumar KR, Sue CM, Münchau A, Klein C (2014) Inclusion Body Myopathy with Paget Disease of Bone and/or Frontotemporal Dementia. 133-138.
- Kimonis VE, Fulchiero E, Vesa J, Watts G (2008) VCP disease associated with myopathy, Paget disease of bone and frontotemporal dementia: Review of a unique disorder. Biochim Biophys Acta 1782: 744-748. [Crossref]
- Devine MS, Kiernan MC, Heggie S, McCombe PA, Henderson RD (2014) Study of motor asymmetry in ALS indicates an effect of limb dominance on onset and spread of weakness, and an important role for upper motor neurons. Amyotroph Lateral Scler Frontotemporal Degener 15: 481-487. [Crossref]
- Valle MS, Casabona A, Fiumara A, Castiglione D, Sorge G et al. (2016) Quantitative analysis of upright standing in adults with late-onset Pompe disease 6.
- Dabby R, Lange DJ, Trojaborg W, Hays AP, Lovelace RE et al. (2001) Inclusion Body Myositis Mimicking Motor Neuron Disease. Arch Neurol 58: 1253-1256. [Crossref]
- Ansved T (2001) Muscle training in muscular dystrophies. Acta Physiol Scand 171: 359-366. [Crossref]
- Jackson C, Barohn R, Gronseth G, Pandya S, Herbelin L (2008) Inclusion body myositis functional rating scale: A reliable and valid measure of disease severity. Muscle Nerve 37: 473-476. [Crossref]
- Ushikubo M (2018) Circumstances and Signs of Approaching Death in Patients with Amyotrophic Lateral Sclerosis Undergoing Noninvasive Ventilation in Home Care Settings. J Neurosci Nurs 50: 182-186. [Crossref]
- Cappola TP, Felker GM, Kao WL, Hare JM, Baughman KL et al. (2002) Pulmonary Hypertension and Risk of Death in Cardiomyopathy. Circulation 105: 1663-1668. [Crossref]
- Berger KI, Chan Y, Rom WN, Oppenheimer BW, Goldring RM (2016) Progression from respiratory dysfunction to failure in late-onset Pompe disease. Neuromuscul Disord 26: 481-489. [Crossref]
- Shoesmith CL, Findlater K, Rowe A, Strong MJ (2007) Prognosis of amyotrophic lateral sclerosis with respiratory onset. J Neurol Neurosurg Psychiatry 78: 629-631. [Crossref]
- Della Marca G, Sancricca C, Losurdo A, Di Blasi C, De Fino C et al. (2013) Sleep disordered breathing in a cohort of patients with sporadic inclusion body myositis. Clin Neurophysiol 124: 1615-1621. [Crossref]
- Danckworth F, Karabul N, Posa A, Hanisch F (2014) Risk factors for osteoporosis, falls and fractures in hereditary myopathies and sporadic inclusion body myositis - A cross sectional survey. Mol Genet Metab Rep 1: 85-97. [Crossref]
- Gregson CL, Hardcastle SA, Cooper C, Tobias JH (2013) Friend or foe: high bone mineral density on routine bone density scanning, a review of causes and management. Rheumatology (Oxford) 52: 968-985. [Crossref]