Journals
STAT3 Knockdown Induces Tumor Formation by MDA-MB-231 Cells
A B S T R A C T
STAT3 plays a central role in oncogenesis by mediating cell survival, growth, and differentiation. It is constitutively activated in breast cancer. We investigated the role of STAT3 in tumor development by knocking down STAT3 levels in MDA-MB-231 triple negative breast cancer cells using short hairpin RNA. The tumor forming potential of these STAT3-depleted cells was assessed by xenografts in immunocompromised NOD SCID mice. Contrary to its accepted tumor promoting role, we found STAT3 to be a negative regulator of growth in MDA-MB-231- derived tumors. Although similar observations have been made in thyroid carcinoma and lung adenocarcinoma xenograft studies, our novel results showed for the first time that the role of STAT3 in promoting tumorigenesis may be context-specific, and that STAT3 may actually be a negative regulator of certain breast-cancer types. Studies to identify the mechanisms of STAT3’s negative regulatory role may be useful in developing STAT3-based therapeutics.
Abbreviations:
Breast cancer, BC; triple negative breast cancer, TNBC; signal transducer and activator of transcription, STAT.
K E Y W O R D S
breast cancer, MDA-MB-231, NOD SCID mice, STAT3, triple negative breast cancer, tumor growth xenograft
I N T R O D U C T I O N
The signal transducer and activator of transcription (STAT) family of proteins function both as signal transducers and transcription factors [1, 2]. Constitutive activation of STAT3 is common in solid tumors of lung, prostate, pancreatic, ovarian, head and neck, thyroid cancer and in certain hematological malignancies [1]. STAT3 is also constitutively activated in more than 50% of primary breast tumors, and overexpression of dominant active mutant form of STAT3 (STAT3C) in immortalized human breast epithelial cells promote tumor growth [3].
To block STAT3 expression and impede tumor growth, the potential use of siRNA in breast cancer [4], shRNA in ovarian and pancreatic cancer [5, 6], and chemical inhibitors (e.g., Stattic, STA-21, S31-201, BP-1-102, and many others) [7] have been explored. These studies established a critical role for STAT3 in cell proliferation, apoptosis, angiogenesis, immune response and metastasis [7]. However, the tumor promoting role of STAT3 has been challenged recently. For example, STAT3 was found to have a tumor-repressing role in prostate cancer [8], thyroid tumorigenesis [9], KRAS-induced lung cancer [10], phosphatase and tensin homolog-deficient glioblastomas [11], adenomatosis polyposis coli (APCMin) model of intestinal cancer [12], and in models of hepatocellular carcinoma where p19(ARF)/P14(ARF) controls oncogenic function of STAT3 [13]. Here, we report for the first time that STAT3 can also have a similar negative regulatory role in tumorigenesis by the MDA-MB-231 triple negative breast cancer (TNBC) cells.
To study the involvement of STAT3 in TNBC, we developed a STAT3-deplete MDA-MB- 231 cell line by knocking down STAT3 expression using shRNA. Xenograft experiments showed that, contrary to earlier studies, STAT3-depletion did not induce any apoptotic cell death in vitro and it enhanced the tumorigenic potential of MDA-MB-231 cells in immunocompromised NOD SCID mice. These results established that, when mechanisms of STAT3’s functional involvement in TNBC are better understood, new therapeutic strategies based on enhancing the STAT3 pool in TNBC cells could be promising.
Materials and methods
I. Materials
RNeasy mini kit (74104), RT2 SYBRR Green qPCR master mix (330502), human primer β-actin (PPH00073G-200), and STAT3 (PPH00708F-200) were purchased from Qiagen;
Superscript R III first-strand synthesis system for RT-PCR (18080-051) was purchased from Invitrogen-Life Technology; selection antibiotic Puromycin dihydrochloride (P-8833) was purchased from Sigma and Blasticidin S hydrochloride (A4166) was purchased from Biometric. Primary antibodies anti-STAT3 (9139) and phospho-STAT3/Tyr705 (9145) were obtained from Cell Signalling Technology; phospho-STAT3/S727 (ab32143) was obtained from Abcam, β actin mouse monoclonal (A2228) was obtained from Sigma; Inhibitor of STAT3, Sttatic (BML-EI368) was purchased from Enzo Life Sciences.
Reagents for routine techniques were purchased from Bio-Rad laboratories, Thermo Fisher Scientific and Sigma Aldrich.
II. Cell culture and treatment
MDA-MB-231 human breast cancer cell line (ATCC® HTB26TM) was purchased from American Type Culture Collection. The cells were maintained in L-15 media supplemented with 10% FBS and 1% penicillin-streptomycin at 37°C in atmospheric air. At 70-80% confluency the cells were brought to quiescence in minimal L-15 medium, for 16-18 hours prior to any treatment.
III. Establishment of STAT3-depleted MDA-MB-231 cell lines
To deplete STAT3 gene expression, MDA-MB-231 cells were transduced with STAT3 MISSION shRNA lentiviral transduction particles (Sigma-Aldrich, SHCLNV 05071406MN) by following manufacturer’s transduction protocol. Five different variants of shRNA with slightly different target sequences were tested for knock-down efficiency. Briefly on day 1, 1.6x10⁴ MDA- MB-231 cells were plated per well in a 96 well plate and incubated at 37°C. On day 2, the media was replaced with 110 ul of fresh media containing hexadimethrine bromide (8 ug/ml). Then about 15.0 ul of each shRNA variant was added per well and incubated at 37°C. After 18 hours the media containing lentiviral particles was removed and 100 ul of fresh medium was added to each well. The following day puromycin (1ug/ml) antibiotic selection for identifying resistant colonies was initiated. Fresh puromycin containing medium was added every 3-4 days. This selection step lasted until the un-transduced control cells were completely dead. Five single cell clones per shRNA construct were generated by serial dilution from the heterogeneous cell population (S3kd-pop). Following validation with qPCR and western blot the single cell clone showing the highest reduction of STAT3 expression was selected as the STAT3-deplete cell line of interest and named S3kd-clone. Control cell line (EV-control) was established using empty vector backbone MISSION pLKO.1-puro non-target shRNA control transduction particles (Sigma-Aldrich, SHC002V) by following a similar protocol. All, starting as well as derived cell lines were labelled with GFP using GFP (Bsd) lentiviral particles (GenTarget,Inc, LVP001) and selected with antibiotic blasticidin (6 ug/ml) for use in in vivo imaging and in vitro cell proliferation measurements.
IV. Establishment of STAT3 rescue cell line
To be able to validate whether some of the observed effects were truly due to STAT3 knock down, we have also constructed a cell line in which STAT3 expression level was partially rescued. GFP expressing single cell clone (S3kd-clone) were subjected to pBabe-STAT3-C retroviral infections [14-16]; (kindly provided by Prof. Bromberg) by following a transduction protocol which was very similar to the protocol mentioned above. The cell line was named as S3-res, STAT3 rescued single cell clone cells.
All derived cell lines were maintained at 37°C in atmospheric air in L-15 media supplemented with 10% FBS and 1% penicillin-streptomycin. Selection antibiotics, puromycin (0.5 ug/ml) and blasticidin (3.0 ug/ul) were added as needed.
Cell lines are abbreviated as follows: i) MDA-MB-231: original starting cells, ii) EV- control: control with pLKO.1 empty vector insert, iii) S3kd-pop: STAT3-depleted heterogeneous cell line, iv) S3kd-clone: single cell clone isolated from heterogeneous S3kd-pop and v) S3-res: clone cell line where depleted STAT3 expression was rescued by STAT3 over-expression.
V. Real time quantitative PCR
The cells from above mentioned cell lines were seeded at a density of 106 cells in 100 mm tissue culture dishes and at 70-80% harvested for total RNA preparation. Total RNA was prepared using the RNeasy Minikit (Qiagen) following manufacturer’s instructions. cDNA was synthesized with M-MLV Superscript III Reverse transcriptase using Superscript III First-Strand Synthesis System for RT-PCR with 1.0 ug of RNA per 20 ul reaction in Eppendorf master thermal cycler. qPCR reaction was performed at a volume of 10 ul per well including 5 ul SYBR green PCR master mix, 0.5 ul assay primer, 2.25 ul cDNA template and 2.25 ul H2O in triplicate with a Bio-Rad 384 CFX detection system.
qPCR data analysis: Collected data were analysed using the ΔΔCT method to compute the fold change in gene expression between control and treated groups [17]. Statistical significance was evaluated using student’s t-test and ANOVA methods.
VI. Western Blot analysis
STAT3 protein expression and phosphorylation at tyrosine (Y705) and serine (S727) sites were measured using western blots [18]. Briefly cells at 75% confluency were lysed using RIPA buffer with protease and phosphatase inhibitors. Total protein concentration of the aspirated supernatant was estimated using the bicinchoninic acid (BCA) assay kit (BCA-1/Sigma) and the absorbance was read at 562 nm in Citation 5 microplate reader. A total protein of 20 μg were loaded per well of 10% TGX precast Bio-Rad SDS page gels. Electrophoresis and trans-blotting was done following routine technique using the Bio-Rad Mini-Protean Tetra System and Trans- blot turbo transfer system respectively. The PVDF membranes were blocked with 5% non-fat dry milk and incubated with primary antibodies for total STAT3 and phospho-STAT3 for tyrosine/Y705 and serine/ S727) residues. β-actin was used as normalizing loading control. Membranes were developed using chemiluminescence ECL reagent (Thermofisher Scientific, cat # 34095). Western blot images were captured with a LI-COR C-Digit scanner and protein band intensities were measured and analysed using LI-COR Image Studio Digits v3.1 software [18].
VII. Cell proliferation studies
In vitro cell proliferation rates were obtained by measuring the fluorescence intensity of GFP labelled cells at 485 nm excitation/528 nm emission using a Cytation-5 microplate reader. Cells were seeded at 10,000 cells/well in 96 well plates, and fluorescence intensity information was collected every 24 hours for 8 consecutive days after the daily fresh media change. When used, pharmacological inhibitor against STAT3 (Stattic) was added in triplicate wells after 24 hours of incubation keeping untreated cells as control. Fresh media (containing inhibitor when used) was replenished every 12 hours.
VIII. Animal experiments
Animal studies to develop xenograft tumours in NOD-SCID mice was approved by the Institutional Animal Care and Use Committee (IACUC) at Washington State University. To develop xenograft tumours, cell suspensions of EV-control or S3kd-clone cells were intraperitoneally injected into 8 weeks old female immunocompromised NOD-SCID mice (Harlan Laboratories) after they were cultured to 70-75% confluency. Tumour growth period varied between 8-11 weeks depending upon inoculum size or until symptoms of severe pain necessitated animal euthanasia. Tumour growth was determined by dissecting and collectively weighing all the GFP positive tumours from each mouse under a microscope.
IX. Statistical Analysis
a) To determine whether obtained STAT3 depletion was statistically significant at the mRNA and protein expression level, p values were calculated using the two-tailed t-test.
b) Statistical significance of xenograft study results was assessed using both the two-tailed t-test and the two-way ANOVA analysis.
Tables
Table 1: Description of experimental sets for developing xenograft tumours
|
|
Set 1A |
Set 1B |
Set 2 |
|||
|
Cell type |
EV-control |
S3kd-clone |
EV-control |
S3kd-clone |
EV-control |
S3kd-clone |
|
Inoculation size (x106 cells/0.2 ml) |
0.5 |
0.5 |
1 |
1 |
13 |
13 |
|
Number of animals |
5 |
5 |
5 |
5 |
10 |
10 |
|
Average tumor growth duration (weeks)* |
10 |
10 |
9.5 |
8.5 |
8 |
7.4 |
* Animals were euthanized after 10 (Set 1) or 8 (Set 2) weeks if they have not developed severe symptoms and had to be euthanized earlier
R e s u l t s
I. Validation of STAT3 knock down and its partial rescue
mRNA expression: Messenger RNA expression levels were quantitated in qPCR experiments with the ΔΔCT method (Fig. 1a). Quantitative analysis showed that compared to the EV-control, the STAT3 gene expression level decreased to 41% in S3kd-pop and decreased to 47% in S3kd-clone cells. STAT3 rescue increased the expression level to 84% in S3-res cells (Fig. 1a). Comparison of p-values computed using the two-tailed t-test analysis was: i) EV-control vs S3kd-pop: 3.30E−07, ii) EV-control vs S3kd-clone: 2.06E−07, iii) EV-control vs S3-res: 4.00E−05. Since the p-values were small in all comparisons, expression differences were statistically significant.
Protein expression: Western blot results for the total and phosphorylated-STAT3 protein levels supported the mRNA results (Fig. 1b). In comparison to the EV-control, total STAT3 expression decreased by 93% in S3kd-pop and by 75% in S3kd-clone, and the reduction level after STAT3 rescue was 63%. Similarly, phosphorylated STAT3 (Tyr705) was reduced by 86% in S3kd-pop and by 87% in S3kd-clone, and rescue decreased the reduction to 73% in S3-res cells. Phosphorylation levels at the Ser727 residue was 15% in S3kd-pop, 11% in S3kd-clone, and 36% in S3-res cells.
STAT3 rescue: Comparison of the results for STAT3 depleted S3kd-pop and S3kd-clone with the results for the STAT3-rescue S3-res cells showed that decreases in the mRNA and total and phosphorylated-STAT3 protein expression level were in fact due to shRNA and not a consequence of off-target effects since the rescue vector partially reversed the effect of STAT3 depletion (Figs. 1a-b). As our goal was simply to observe a reversal in the trend upon rescue, further rescuing STAT3 expression to its original levels was not pursued.
Two-tailed t-test analysis showed p-values ≤ 0.05 when protein expression level for total STAT3, phosphorylated STAT3 (Tyr705), phosphorylated STAT3 (Ser727) were compared between STAT3 depleted over control and STAT3 rescued over control. Therefore, STAT3 depletion and rescue at protein level were statistically significant.
II. STAT3 depletion with shRNA increases in vitro cell proliferation
To investigate the impact of STAT3 knockdown, we first measured the proliferation profiles of the constructed cell lines in vitro. Fluorescence intensity measurement of GFP expressing cells established that observed growth rate order of MDA-MB-231 cells was inversely proportional to their STAT3 expression level: S3kd-pop > S3kd-clone > S3-res > EV-control (Fig. 2a). As expected, the proliferation rate of S3-res cells closely matched that of the EV-control and MDA-MB-231 cell lines (Fig. 2a). This indicated that, as it should, rescuing STAT3 expression reverses the effect of STAT3 knock down, which validated that the observed proliferation rate change was indeed due to STAT3 depletion with shRNA.
To test the response of these constructed cell lines to pharmacological inhibition of STAT3 we also measured the in vitro growth profile when they were treated with STAT3 chemical inhibitor Sttatic (10 uM). As opposed to proliferation observed without the inhibitor (Fig. 2a), exposure to Sttatic led to cell death after a few days (Fig. 2b).
III. Xenograft studies
Our primary objective in this study was to determine how the reduction in STAT3 expression affected tumor forming ability of MDA-MB-231 cells in vivo. We first performed a pilot xenograft study with smaller groups of NOD SCID mice (5 animals/group, Sets 1A and 1B as shown in Table 1). The results demonstrated that the tumorigenic potential of STAT3-deplete MDA-MB-231 cells were higher than control (Figs. 3a-b) but the statistical significance of the observed differences was low. Two-way ANOVA analysis of four groups (two inoculation levels x depleted vs. control) resulted in a p-value of 0.073, showing that the observed differences were not significant. The difference in inoculation level was the dominant factor in lowering the p-value. The two-tailed t- test results for comparison of the STAT3-deplete and control groups were 0.27 and 0.74 respectively for the 1.0x10⁶ and 0.5x10⁶ cell inoculations. A visual comparison of the developed tumour masses for the EV-control and S3kd-clone injected mice showed that tumour mass was larger in the latter group when 1.0x10⁶ cells were inoculated (Fig. 3b and 3d) but the difference was less clear for the 0.5x10⁶ inoculum size (Fig. 3a and 3d). These results for the pilot xenograft studies showed that i) STAT3-deplete MDA-MB-231 cells led to the growth of tumours which were either as large as or larger than those of the control group on average, and ii) larger inoculation levels were necessary to amplify the differences for better statistical resolution.
We therefore repeated the xenograft experiments using a larger group of animals and higher inoculation levels to increase the statistical power (10 animals/group, set 2 as shown in Table 1). Power analysis with an expectation that technical errors ≤ 5% and a two-tailed p-value threshold ≤ 0.05 showed that this animal group size was adequate. Experimental conditions were identical to the pilot study except that 1.3x10⁷ cells suspended in solution were injected into every animal. Advantages of injecting larger inoculum sizes were formation of larger tumours with earlier onset, which shortened the period of pain burden on animals, too. Animals injected with STAT3-deplete cells showed more sickness related symptoms than the animals injected with the control cells. The average tumour mass was 466 mg and 130 mg for S3kd-clone and EV-control cells, respectively (Figs. 3c and 3e). Two-tailed t-test on tumour mass data comparison showed a statistical significance of 0.0084 between the two cell lines. Results of this expanded study confirmed the pilot study findings in a statistically significant way that, compared to EV-control, S3kd-clone was more tumorigenic.
The animals injected with the S3kd-clone cells typically developed larger volume of ascites in the peritoneal cavity than controls, and tumour mass vs ascites fluid correlated well. Tumour growth occurred in mesenteric regions of small and large intestinal tract, duodenal area, liver, posterior region of the junction of oesophagus and stomach, peritoneal cavity of lower abdomen, uterine wall, discretely near pancreas, lymph node and renal adipose tissue (data not shown).
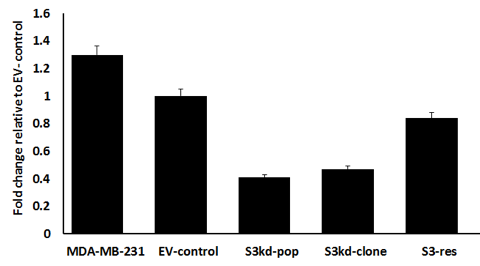
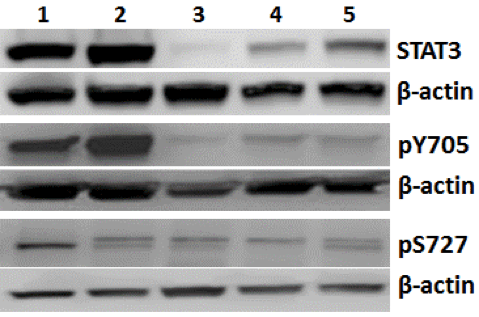
Figure 1a) STAT3 mRNA expression measurement using quantitative real time PCR to validate STAT3 mRNA knockdown. Cell lines are: 1) MDA-MB-231, 2) empty vector control (EV- control), 3) multiclonal STAT3 knockdown (S3kd-pop), 4) single cell clone STAT3 knockdown (S3kd-clone), and 5) rescued single cell clone STAT3 knockdown (S3-res). Quantitative analysis was done using the ∆∆CT method.
b) Validation of STAT3 depletion at protein level using Western blots. Cell lines are: 1) MDA- MB-231, 2) empty vector control (EV-control), 3) multiclonal STAT3 knockdown (S3kd-pop), 4) single cell clone STAT3 knockdown (S3kd-clone), and 5) rescued single cell clone STAT3 knockdown (S3-res). Equal amount of protein was loaded on each gel lane. The protein levels were detected using antibodies against total STAT3, phospho-tyrosine STAT3 and phospho-serine STAT3. β-actin was used as a loading control. Protein levels were expressed as background corrected protein band intensities normalized to β-actin loading control.

Figure 2a) Cell proliferation rates of GFP expressing cells were measured with Cytation 5 micro- plate reader over a period of 8 days. Legends for the cell lines 1) MDA-MB-231, 2) empty vector control (EV-control), 3) multiclonal STAT3 knockdown (S3kd-pop), 4) single cell clone STAT3 knockdown (S3kd-clone), and 5) rescued single cell clone STAT3 knockdown (S3-res) are shown in the plot.
b) The cell proliferation rates of GFP expressing cells were measured with Cytation 5 micro- plate reader after treatment with chemical inhibitor of STAT3, Stattic (10 uM). The cell lines were: 1) MDA-MB-231, 2) empty vector control (EV-control), 3) multiclonal STAT3 knock down cells (S3kd-pop), 4) single cell clone STAT3 knock down (S3kd-clone), and 5) rescued single cell clone STAT3 knock down (S3-res). The in vitro proliferation studies showed extensive cell death within few days after treatment with Stattic.
Figure 3a) STAT3 knockdown in MDA-MB-231 cells (S3kd-clone) increased their tumorigenic activity. After STAT3 was knockdown by shRNA in MDA-MB-231cells,
a) 0.5x10⁶ cells or
b) 1.0x10⁶ cells were injected into NOD SCID mice. Lower tumor mass was observed in the mice injected with empty vector transfected (EV-control) cells than STAT3 knockdown S3kd-clone cells for both initial injection cases with 0.5x10⁶ and 1.0x10⁶ cells.
c) Injection of 1.3x10⁷ cells of empty vector control (EV-control) and STAT3 knockdown (S3kd-clone) in NOD SCID mice led to very high tumor mass in the STAT3 knock down injected mice.
d) Compared to the case of higher injection level with 1.0x10⁶ cells, latency of tumor growth was longer when initial injection level was 0.5x10⁶ cells.
e) Latency period for tumor induction was shorter in the STAT3 knockdown (S3kd-clone) injected mice than empty vector control (EV- control) when mice was injected with 1.3x10⁷ cells initially.
D i s c u s s i o n
Constitutively activated STAT3 is commonly believed to promote proliferation and metastasis in different cancers including breast [19]. Our in vivo xenograft (Fig. 3) and in vitro cell proliferation rate (Fig. 2) studies established that STAT3 has a negative regulatory role in tumorigenesis by the MDA-MB-231 cancer cells. Our novel findings added triple negative subtype of breast cancer to the ever-growing list of cancer types where similar roles for STAT3 has been observed earlier. Even though a similar negative regulatory role has been observed in several other tumour types, our findings were novel for this particular case.
STAT3 is commonly accepted to be a positive regulator of proliferation and tumorigenesis, in our in vivo study animal injected with STAT3-depleted MDA-MB-231 exhibited larger tumours and the latency period of tumour induction was shorter in comparison to control. Although our study for the first time inferred such a negative regulatory role of STAT3, there are other published studies that support our finding. STAT3 has a very similar negative regulatory role in thyroid carcinoma [9]; and in lung adenocarcinoma [20]; STAT3 functions as a tumour suppressor in phosphatase and tensin homolog-deficient glioblastoma [11]; STAT3 deficiency in adenomatosis polyposis coli (APCMin) model of intestinal cancer led to enhanced tumour progression characterized by the development of invasive, more proliferative carcinoma [12]; in models of hepatocellular carcinoma, p19 alternate open reading frame (ARF) dictates tumour-suppressive vs tumour-promoting behaviour of STAT3 [13]; STAT3 functions as a tumour suppressor in KrasGD12d+ lung tumours as well as KRAS mutant human AC cell lines [10]; and genetic inactivation of STAT3 or IL-6 signalling pathway accelerates cancer progression in PTEN-deficient PCa mouse model leading to metastasis [8]. These earlier studies were done in different cancer types and different cell lines. The previous studies and the results communicated in this study collectively support the multi-functional role of STAT3 in tumorigenesis, i.e., that STAT3 has a context and/or cell type dependent tumour promoting and suppressing role [21].
The present observation indicates that STAT3 has dual function, both in favour and against tumour induction. The suppression of tumorigenesis by STAT3 in these modified triple negative MDA-MB-231 BC cells can further be supported by the immunohistochemical observations from 346 node-negative BC patient’s tissues detecting STAT3 localization and phosphorylation [22]. This test for anti-STAT3 and anti-phospho-STAT3 expression and localization found that nuclear phospho-STAT3 expression was correlated with a modest, but statistically significant improvement in patient survival both at 5 and 20 years [22]. A similar result was seen in head and neck squamous cell carcinoma where high nuclear STAT3 expression level was associated with longer progression-free survival [23]. Localization pattern studies of STAT3 in patient tumour samples are very limited. This association between STAT3 nuclear localization/phosphorylation and improved patient survival makes stronger argument in favour of STAT3 playing an anti- tumorigenic role in the above tissues.
The findings from the cell proliferation studies support the above results as well. Though apoptotic cell death is common on STAT3 inhibition with RNAi [4] the multi-clonal and single- cell clones exhibited a faster cell growth than control in the current context. It’s not a discrete event since proliferation of 4T1 mouse mammary carcinoma cells was also not affected by STAT3 knockdown either [24].
Our study also predicts a difference in mechanism of action and responses between chemical inhibition and mRNA knockdown of STAT3. In principle, similar trends in the proliferation would be expected on chemical or biological inhibition of STAT3. But in the present case blocking STAT3 with Stattic causes cell death while knocking down STAT3 with shRNA enhances the growth rate of MDA-MB-231 cells. STAT3 small molecule inhibitor-based cancer therapy efforts could not advance to clinical level because of specificity and cytotoxicity problems [25]. STAT3 lacks a hydrophobic ATP-binding cleft where small molecule kinase inhibitors prefer to bind [25]. The three targetable domains of STAT3, the N-terminal, SH2, and DNA binding domains are large planar surfaces, usually not ideal for specific binding of small molecules, thus raising serious cytotoxicity and specificity issues. In this regard, peptide or oligonucleotide-based approaches could prove to be better to target STAT3 effectively. These opposing effects on cellular responses after chemical inhibition or mRNA knockdown of STAT3 requires further studies to unravel the differences in their underlying mechanisms.
In this study, we report a novel observation that depleting STAT3 expression by shRNA in MDA-MB-231 enhances tumour growth in xenograft model. This highlights a possible dual role of STAT3 thereby indicating that constitutive activation of STAT3 could be considered as a measure of either tumour progression or suppression based on cell type. Targeting STAT3 for therapy may therefore be based on the origin of the tumour type. This can be critical when considering breast tissues in particular because STAT3 is an essential mediator of apoptosis and post-lactational regression [26]. If normal functioning of STAT3 is related to apoptosis and regression in mammary gland, STAT3 removal would raise the probability of an anti-apoptotic activity as its more appropriate function. This intricate balance between apoptotic and anti-apoptotic role of STAT3 in the functioning of mammary gland and breast tissues needs to be accurately defined before targeting breast tumours with STAT3 inhibitors. Observed negative regulatory role for STAT3 also implies that therapeutic strategies leveraging on enhancing the STAT3 pool in TNBC cells instead of inhibiting it may be an alternate approach for therapy which needs further exploration.
A c k n o w l e d g e m e n t s
This work was supported by the National Institute of Health, USA [grant number 5R01GM072821 and by Washington State University, WA, USA, start-up funds to Dr. Haluk Resat
Conflicts of interest
There is no conflict of interest among the authors listed in the article.
Article Info
Article Type
Research ArticlePublication history
Received: Mon 26, Feb 2018Accepted: Wed 07, Mar 2018
Published: Mon 26, Mar 2018
Copyright
© 2023 Kasturi Banerjee. This is an open-access article distributed under the terms of the Creative Commons Attribution License, which permits unrestricted use, distribution, and reproduction in any medium, provided the original author and source are credited. Hosting by Science Repository.DOI: 10.31487/j.COR.2018.10.002
Author Info
Corresponding Author
Kasturi BanerjeeThe Gene and Linda Voiland School of Chemical Engineering and Bioengineering, Washington State University, Pullman,WA,USA
Figures & Tables
Table 1: Description of experimental sets for developing xenograft tumours
|
|
Set 1A |
Set 1B |
Set 2 |
|||
|
Cell type |
EV-control |
S3kd-clone |
EV-control |
S3kd-clone |
EV-control |
S3kd-clone |
|
Inoculation size (x106 cells/0.2 ml) |
0.5 |
0.5 |
1 |
1 |
13 |
13 |
|
Number of animals |
5 |
5 |
5 |
5 |
10 |
10 |
|
Average tumor growth duration (weeks)* |
10 |
10 |
9.5 |
8.5 |
8 |
7.4 |
* Animals were euthanized after 10 (Set 1) or 8 (Set 2) weeks if they have not developed severe symptoms and had to be euthanized earlier
Lanes: 1) MDA-MB-231; 2) EV-control; 3) S3kd-pop 4) S3kd-clone 5) S3-res
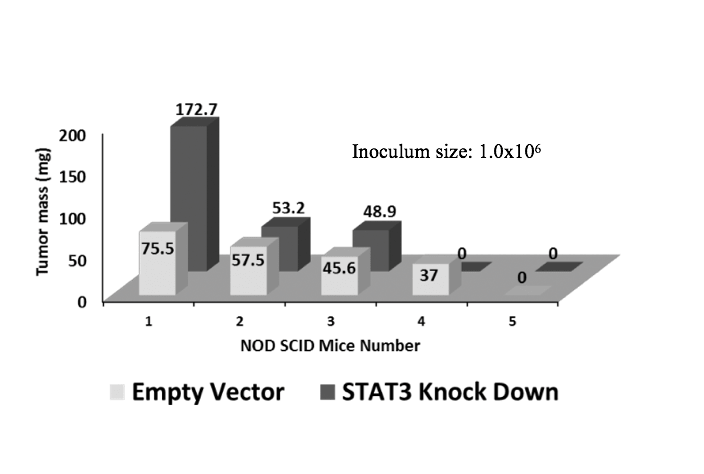
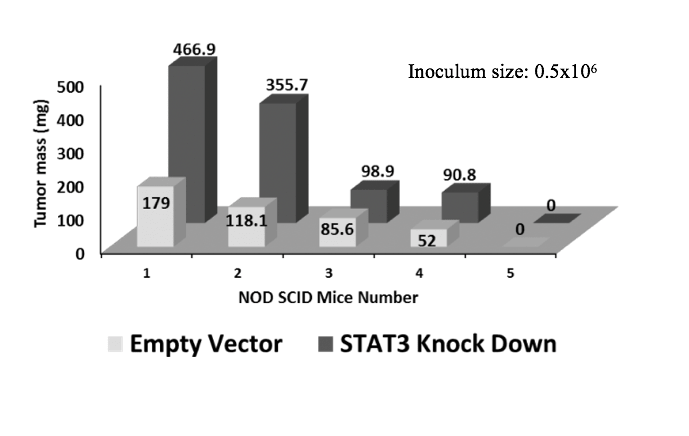
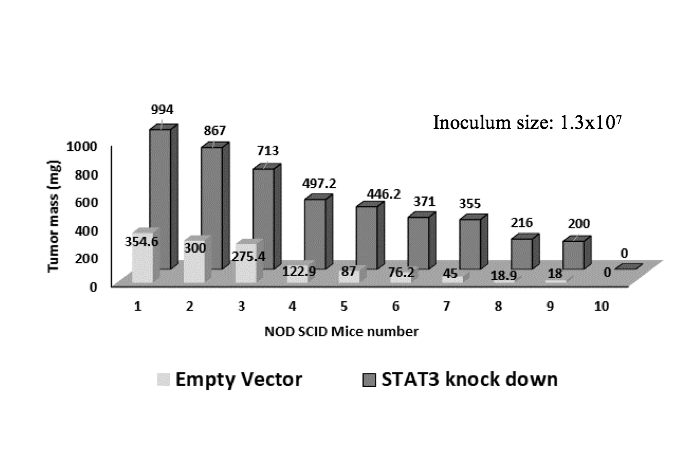
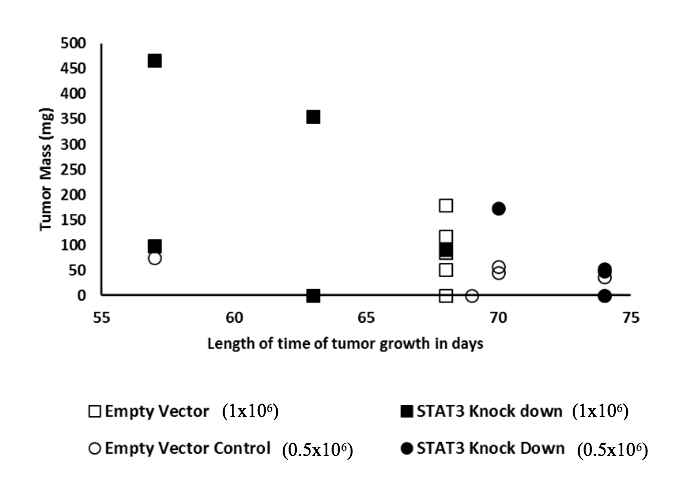
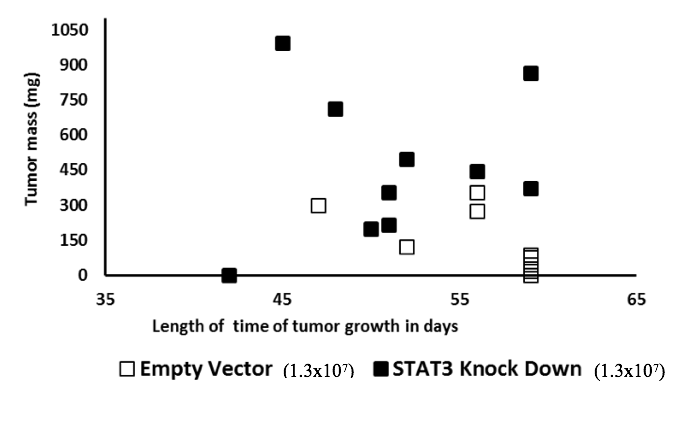
Figure legends
Fig. 1 a) STAT3 mRNA expression measurement using quantitative real time PCR to validate STAT3 mRNA knockdown. Cell lines are: 1) MDA-MB-231, 2) empty vector control (EV- control), 3) multiclonal STAT3 knockdown (S3kd-pop), 4) single cell clone STAT3 knockdown (S3kd-clone), and 5) rescued single cell clone STAT3 knockdown (S3-res). Quantitative analysis was done using the ∆∆CT method.
b) Validation of STAT3 depletion at protein level using Western blots. Cell lines are: 1) MDA- MB-231, 2) empty vector control (EV-control), 3) multiclonal STAT3 knockdown (S3kd-pop), 4) single cell clone STAT3 knockdown (S3kd-clone), and 5) rescued single cell clone STAT3 knockdown (S3-res). Equal amount of protein was loaded on each gel lane. The protein levels were detected using antibodies against total STAT3, phospho-tyrosine STAT3 and phospho-serine STAT3. β-actin was used as a loading control. Protein levels were expressed as background corrected protein band intensities normalized to β-actin loading control.
Fig. 2 a) Cell proliferation rates of GFP expressing cells were measured with Cytation 5 micro- plate reader over a period of 8 days. Legends for the cell lines 1) MDA-MB-231, 2) empty vector control (EV-control), 3) multiclonal STAT3 knockdown (S3kd-pop), 4) single cell clone STAT3 knockdown (S3kd-clone), and 5) rescued single cell clone STAT3 knockdown (S3-res) are shown in the plot.
b) The cell proliferation rates of GFP expressing cells were measured with Cytation 5 micro- plate reader after treatment with chemical inhibitor of STAT3, Stattic (10 uM). The cell lines were: 1) MDA-MB-231, 2) empty vector control (EV-control), 3) multiclonal STAT3 knock down cells (S3kd-pop), 4) single cell clone STAT3 knock down (S3kd-clone), and 5) rescued single cell clone STAT3 knock down (S3-res). The in vitro proliferation studies showed extensive cell death within few days after treatment with Stattic.
Fig. 3 STAT3 knockdown in MDA-MB-231 cells (S3kd-clone) increased their tumorigenic activity. After STAT3 was knockdown by shRNA in MDA-MB-231cells,
a) 0.5x10⁶ cells or
b) 1.0x10⁶ cells were injected into NOD SCID mice. Lower tumor mass was observed in the mice injected with empty vector transfected (EV-control) cells than STAT3 knockdown S3kd-clone cells for both initial injection cases with 0.5x10⁶ and 1.0x10⁶ cells.
c) Injection of 1.3x10⁷ cells of empty vector control (EV-control) and STAT3 knockdown (S3kd-clone) in NOD SCID mice led to very high tumor mass in the STAT3 knock down injected mice.
d) Compared to the case of higher injection level with 1.0x10⁶ cells, latency of tumor growth was longer when initial injection level was 0.5x10⁶ cells.
e) Latency period for tumor induction was shorter in the STAT3 knockdown (S3kd-clone) injected mice than empty vector control (EV- control) when mice was injected with 1.3x10⁷ cells initially.
References
1. Siveen KS, Sikka S, Surana R, Dai X, Zhang J, et al. (2014) Targeting the STAT3 signalling pathway in cancer: role of synthetic and natural inhibitors. Biochim Biophys Acta 1845: 136-154. [Crossref]
2. Xiong A, Yang Z, Shen Y, Zhou J, Shen Q (2014) Transcription Factor STAT3 as a Novel Molecular Target for Cancer Prevention. Cancers (Basel) 6: 926-957. [Crossref]
3. Dechow TN, Pedranzini L, Leitch A, Leslie K, Gerald WL, et al. (2004) Requirement of matrix metalloproteinase-9 for the transformation of human mammary epithelial cells by Stat3-C. Proc Natl Acad Sci U S A 101: 10602-10607. [Crossref]
4. Kunigal S, Lakka SS, Sodadasu PK, Estes N, Rao JS (2009) Stat3-siRNA induces Fas-mediated apoptosis in vitro and in vivo in breast cancer. Int J Oncol 34: 1209-1220. [Crossref]
5. Huang F, Tong X, Fu L, Zhang R (2008) Knockdown of STAT3 by shRNA inhibits the growth of CAOV3 ovarian cancer cell line in vitro and in vivo. Acta Biochim Biophys Sin (Shanghai) 40: 519-525. [Crossref]
6. Li Hd, Huang C, Huang Kj, Wu Wd, Jiang T, Cao J, et al. (2011) STAT3 knockdown reduces pancreatic cancer cell invasiveness and matrix metalloproteinase-7 expression in nude mice. PLoS One 6: 25941. [Crossref]
7. Fagard R, Metelev V, Souissi I, Baran-Marszak F (2013) STAT3 inhibitors for cancer therapy: Have all roads been explored? Jaksta 2: 22882. [Crossref]
8. Pencik J, Schlederer M, Gruber W, Unger C, Walker SM, et al. (2015) STAT3 regulated ARF expression suppresses prostate cancer metastasis. Nat Commun 6: 7736. [Crossref]
9. Couto JP, Daly L, Almeida A, Knauf JA, Fagin JA, et al. (2012) STAT3 negatively regulates thyroid tumorigenesis. Proc Natl Acad Sci U S A 109: 2361-2370. [Crossref]
10. Grabner B, Schramek D, Mueller KM, Moll HP, Svinka J, et al. (2015) Disruption of STAT3 signalling promotes KRAS-induced lung tumorigenesis. Nat Commun 6: 6285. [Crossref]
11. de la Iglesia N, Konopka G, Puram SV, Chan JA, Bachoo RM, et al. (2008) Identification of a PTEN-regulated STAT3 brain tumour suppressor pathway. Genes Dev 22: 449-462. [Crossref]
12. Musteanu M, Blaas L, Mair M, Schlederer M, Bilban M, et al. (2010) Stat3 is a negative regulator of intestinal tumour progression in Apc(Min) mice. Gastroenterology 138: 1003-1011. [Crossref]
13. Schneller D, Machat G, Sousek A, Proell V, van Zijl F, et al. (2011) p19(ARF) /p14(ARF) controls oncogenic functions of signal transducer and activator of transcription 3 in hepatocellular carcinoma. Hepatology 54: 164-172. [Crossref]
14. Bromberg J.F, Horvath C.M, Besser D, Lathem W.W, Darnell J.E, et al. (1998) Stat3 activation is required for cellular transformation by v- src. Mol Cell Biol 18: 2553-2558. [Crossref]
15. Bromberg JF, Wrzeszczynska MH, Devgan G, Zhao Y, Pestell RG, et al. (1999) Stat3 as an oncogene. Cell 98: 295-303. [Crossref]
16. Shen Y, Devgan G, Darnell JE, Bromberg JF (2001) Constitutively activated Stat3 protects fibroblasts from serum withdrawal and UV-induced apoptosis and antagonizes the proapoptotic effects of activated Stat1. Proc Natl Acad Sci U S A 98: 1543-1548. [Crossref]
17. Livak KJ, Schmittgen TD (2001) Analysis of relative gene expression data using real-time quantitative PCR and the 2(-Delta Delta C(T)) Method. Methods 25: 402-408. [Crossref]
18. Speth Z, Islam T, Banerjee K, Resat H (2017) EGFR signaling pathways are wired differently in normal 184A1L5 human mammary epithelial and MDA-MB-231 breast cancer cells. J Cell Commun Signal 11: 341-356. [Crossref]
19. Clevenger CV (2004) Roles and regulation of stat family transcription factors in human breast cancer. Am J Pathol 165: 1449-1460. [Crossref]
20. Grabner B, Schramek D, Mueller KM, Moll HP, Svinka J et al., (2015) Disruption of STAT3 signalling promotes KRAS-induced lung tumorigenesis. Nat Commun 6. [Crossref]
21. Carpenter RL, Lo HW, (2014) STAT3 Target Genes Relevant to Human Cancers. Cancers (Basel) 6: 897-925. [Crossref]
22. Dolled-Filhart M, Camp RL, Kowalski DP, Smith BL, Rimm DL (2003) Tissue microarray analysis of signal transducers and activators of transcription 3 (Stat3) and phospho-Stat3 (Tyr705) in node-negative breast cancer shows nuclear localization is associated with a better prognosis. Clin Cancer Res 9: 594-600. [Crossref]
23. Pectasides E, Egloff AM, Sasaki C, Kountourakis P, Burtness B, et al. (2010) Nuclear localization of signal transducer and activator of transcription 3 in head and neck squamous cell carcinoma is associated with a better prognosis. Clin Cancer Res 16: 2427-34. [Crossref]
24. Ling X, Arlinghaus RB, (2005) Knockdown of STAT3 expression by RNA interference inhibits the induction of breast tumours in immunocompetent mice. Cancer Res 65: 2532-2536. [Crossref]
25. Wake MS, Watson CJ, (2015) STAT3 the oncogene - still eluding therapy? Febs j 282: 2600-2611. [Crossref]
26. Watson C.J, (2001) Stat transcription factors in mammary gland development and tumorigenesis. J Mammary Gland Biol Neoplasia 6: 115-127. [Crossref]