Journals
In-Silico 3D QSAR And Pharmacophore Mapping of C-Kit Inhibitors Towards Anticancer Drug Development
A B S T R A C T
c-KIT is a receptor tyrosine kinase reported in, small cell lung cancer and other human cancers. Marketed c-KIT inhibitors are suffering from tribulations of getting resistance and/or potential cardio toxicity. To identify potential novel c-KIT inhibitors, in the present project work, we have built an atom-featured 3D QSAR model using Schrodinger’s Maestro 9.0 molecular modeling suit. The developed 3D QSAR model ‘ADHRR.21’ is statistically significant (R2=0.8764, Q2 =0.7432) and instituted to be robust enough with good predictive accuracy, confirmed by external validation approaches, Y-randomization.
K E Y W O R D S
c-KIT inhibitors, indolin-2-one, pharmacophore, 3D QSAR
I N T R O D U C T I O N
Mutation in the c-KIT receptor is observed in certain cancer cells. Quantification of c-KIT from malignant tissue may help in the prognosis and treatment of those types of cancers [1]. Protein tyrosine kinases (PTKs) have critical implications in regulatory signaling mechanisms that are responsible for growth, activation, differentiation, and transformation [2]. c-KIT is also a protein tyrosine kinase (PTK) that is vital for mast cell discrimination, propagation, and secretion of cytokines [3]. c-KIT is a component of the platelet derived growth factor receptor (PDGFR) family categorized as type-III RTK (receptor tyrosine kinase) [4]. A mutation in c-KIT kinase reduces its binding to the stem cell factor. This binding has implications in several human tumors, including gastrointestinal stromal tumors, myeloid leukemia, germ cell tumors, and in mastocytosis [5]. The over expression of the c-KIT proto-oncogene has also been observed in, small cell lung cancer [6]. The percentage of functional mutation associated with c-KIT in various cancers is as follows, gastrointestinal stromal tumors (90%), mastocytomas (70%), Sino nasal T–cell lymphomas (16%), and seminomas/dysgerminomas (9%) [7].
Imatinib mesylate (Glivec) is the first small molecule RTK inhibitor, shown significant results in the management of several cancers. It is effective against multi-receptor targets (tyrosine kinases) including c-KIT. This drug has also shown remarkable results for the treatment of tumors concerning PDGFR’s, such as dermato fibrosarcoma protuberans and glioblastoma [8]. c-KIT receptor also involved in the inflammatory and autoimmune diseases related to mast cells [9, 10]. Some preclinical studies on Glivec revealed that, it is efficient against mast cells in rodent arthritis models [11]. Another drug, Sunitinib malate (Sutent), is also an anti-angiogenic multi targeted PTK inhibitor viz. c-KIT, PDGFR, Fms like tyrosine kinase (sFlt1) and VEGFR [8]. Imatinib mesylate & Sunitinib malate both drugs were found to be victims of getting resistance by secondary mutation D816H/V, N822K, Y822K, A829P that are situated in the activation loop (A-loop) of the KIT catalytic site [12].
Sunitinib is a prototype from the indolin–2–one’s structural scaffolds as RTKI however; several other reports are available on c-KIT inhibitors containing indolin–2–one scaffolds [13, 14]. To our knowledge so far, very less reports are available, to get insight of structural features essentiality towards c-KIT inhibition and pharmacophore modeling for the design and discovery of novel c-KIT inhibitors [15]. In one report, 3D pharmacophore mapping is performed on diaryl urea series as c-KIT antagonists, but due to lack of molecular docking study, understanding of actual binding of the inhibitors to the receptor is ambiguous [5].
The objective was developing an in-silico pharmacophore model and docking study on previously reported inhibitors. Pharmacophore and quantitative structural activity relationship (QSAR) are the ligand-based molecular modeling techniques. These techniques apply general studies associated with the interaction of various molecules with the same target, that may comprise similar structural or physiochemical properties. The correct pharmacophore model gives the information regarding hydrogen binding properties (acceptor or donor), hydrophobic properties, and aromatic functionality presented by compounds in the dataset. This information could be exploited for the characterization of structurally diverse compounds acting on the same bio-molecules [16].
Three dimensional (3D) QSAR study considers 3D conformers in the space and covers overall force field around a molecule instead of only spotlighting pharmacophoric information [17]. 3D QSAR takes the account of electrostatic, steric, hydrophobic interactions and hydrogen-bond donor/acceptor factors for the force field calculations. This calculation gives the best results when interacting ligands share unique structural scaffold [18]. So, pharmacophore modeling and 3D QSAR can be useful for lead optimization or lead modification by rational drug design approach. On this ground, to develop a true pharmacophore that is required for the c-KIT activity, we have chosen 3- pyrrolo [β] cyclohexylene-2-dihydroindolinone series recently reported by Ding et al. (2013) for various RTKs inhibition including c-KIT [19].
Experimental
Methodology and Computational Details
3D QSAR was completed using PHASE 3.1 (Schrodinger 2009, LLC, NY, USA) [20,21]; as incorporated in the Maestro 9.0 (Schrodinger 2009, LLC, NY, USA) installed on a machine of Pentium IV 3.06 GHz, Core 2 Quad PC with Windows 7 operating system. Domain of applicability of developed QSAR model was determined by open-access online application ‘AD using Standardization approach’ version 1.0 [22].
Dataset
Twenty-five indolin–2–one derivatives previously reported for its c-KIT inhibition profile was taken for QSAR studies (Table 1) [19]. Although in the chosen dataset of indolin–2–ones; the number of molecules synthesized and studied for its RTKs inhibitions were comparatively less but there is some peculiarity observed on these molecules. This set offers a very diverse range of biological activity and around 65 percent of the compounds were more active than the standard used (sunitinib). The potency of some compounds was 30 to 40 folds less than the standard one (sunitinib). This was our rationale behind a research investigation to find out the answers to the questions that, what would be the structural characteristics responsible for its less potency? The answers could be obtained by studying 3D QSAR on this series. In-vitro IC50 (inhibition concentrations) of the molecules against c-KIT were converted to equivalent pIC50 [−log (IC50)]. Values of pIC50 were considered as dependent variables in the development of QSAR Model.
The structures of the compounds along with IC50/pIC50 values are specified in Table 1. Out of 25 compounds, 20 were selected randomly as training set entries and 5 were selected as test set entries by using the ‘Random training set’ option available in the PHASE 3.1 module. Division of the compounds in training set and test set is done on the grounds of suggestions given by Golbraikh A. et al. (2003). As minimum five compounds must be selected for the test set, this selection was done by satisfying three conditions, a) all representative points of the test set in the multi-dimensional descriptor space must be close to those of training set. b) vice-versa with that of training set, c) The representative points of the training set must be distributed within the whole area occupied by the entire dataset. Training set was used to generate a QSAR model whilst; test set was used for validation of generated model. Selection of both sets was done to secure a wide range of biological activity, i.e. least to most active [23].
Tables
|
Structure |
IC50 (nM) |
Observed pIC50 |
Predicted pIC50 |
||
|
R1 |
R2 |
||||
|
b1. |
H |
NH(CH2)2N(CH2CH3)2 |
11.7 |
-1.072d |
-0.97 |
|
a2. |
5-F |
NH(CH2)2N(CH2CH3)2 |
2.4 |
-0.38d |
-0.49 |
|
b3. |
5-Cl |
NH(CH2)2N(CH2CH3)2 |
2.7 |
-0.431d |
-0.59 |
|
b4. |
5-Br |
NH(CH2)2N(CH2CH3)2 |
2.3 |
-0.362d |
-0.43 |
|
b5. |
5-CH3 |
NH(CH2)2N(CH2CH3)2 |
4.1 |
-0.613d |
-0.60 |
|
a6. |
5-OCH3 |
NH(CH2)2N(CH2CH3)2 |
35.5 |
-1.55c |
-1.52 |
|
b7. |
5-NO2 |
NH(CH2)2N(CH2CH3)2 |
6.9 |
-0.839d |
-0.88 |
|
b8. |
5-COOCH3 |
NH(CH2)2N(CH2CH3)2 |
255.7 |
-2.408c |
-2.41 |
|
b9. |
5-SO2N(CH2CH3)2 |
NH(CH2)2N(CH2CH3)2 |
397.6 |
-2.599c |
-2.55 |
|
b10. |
4-F |
NH(CH2)2N(CH2CH3)2 |
43.1 |
-1.634c |
-1.69 |
|
a11. |
7-F |
NH(CH2)2N(CH2CH3)2 |
180.8 |
-2.257c |
-2.16 |
|
b12. |
5-F |
NH(CH2)2-morpholin-4-yl |
2 |
-0.301d |
-0.42 |
|
b13. |
5-F |
NH(CH2)2-piperidin-1-yl |
5.8 |
-0.763d |
-0.78 |
|
b14. |
5-F |
NH(CH2)2-pyrrolidin-1-yl |
7.4 |
-0.869d |
-0.78 |
|
b15. |
5-F |
NH(CH2)2N(CH3)2 |
6.6 |
-0.82d |
-0.92 |
|
b16. |
5-F |
NH(CH2)2OH |
1.4 |
-0.146d |
-0.19 |
|
b17. |
5-F |
NH(CH2)2-pyridin-2-yl |
37.7 |
-1.576c |
-1.67 |
|
b18. |
5-F |
NH(CH2)3N(CH2CH3)2 |
9.9 |
-0.996d |
-1.02 |
|
a19. |
5-F |
NH(CH2)3-morpholin-4-yl |
5.7 |
-0.756d |
-0.77 |
|
b20. |
5-F |
NH(CH2)3-pyrrolidin-1-yl |
10.7 |
-1.029d |
-1.01 |
|
b21. |
5-F |
NHCH2CH(OH)CH2N(CH2CH3)2 |
4.1 |
-0.613d |
-0.60 |
|
b22. |
5-F |
Morpholin-4-yl |
2.1 |
-0.322d |
-0.37 |
|
a23. |
5-F |
IMAGE |
7.8 |
-0.892d |
-0.85 |
|
b24. |
5-F |
IMAGE |
8.5 |
-0.929d |
-0.89 |
|
b25. |
Sunitinib _ _ |
8.9 |
-0.949d |
-0.95 |
|
Pharmacophore modelling and 3D QSAR development

Fig.1 Steps in Pharmacophore modelling
All the compounds were sketched on the workspace in Maestro 9.0 and incorporated as a separate entry in the project table. For defining a ‘pharma set’ in PHASE, activity threshold range was selected as; compounds are active if pIC50 value is above -1.1073 and inactive if below -1.500. This resulted in 19 compounds to be ‘actives’ and 6 compounds as ‘inactives’. Steps carried out for pharmacophore and 3D QSAR development are given in Energy minimization of structures was performed on ‘LigPrep’ module version 2.3 (Schrodinger 2009, LLC, NY, USA) using optimized potentials for liquid simulations (OPLS)–2005 force field method. OPLS-2005 method works on the steepest descent technique and truncated Newton conjugate gradient protocol. In this protocol initially, structures were preprocessed by incorporation of hydrogen and then stereoisomers were generated. The ionization state of the molecules (if any) was identified at pH 7.0. Most of the indolin–2–ones under study were flexible, but all possible conformations were allowed to being generated in order to fetch the active confirmation that would be similar to the structure actually binding to the c-KIT. Three-dimension spatial representations of the structures were necessary for the development of a true pharmacophore model [24]. We have chosen atom-based 3D QSAR rather pharmacophore-based 3D QSAR because atom-based 3D QSAR covers the entire structural space around; where as other model only considers the requisite pharmacophoric group points [25]. In PHASE 3.1, the pharmacophoric properties such as hydrogen-bond donor (D), hydrogen-bond acceptor (A), aromatic ring (R), hydrophobic moiety (H), negatively ionized group (N), and positively ionized group (P) are taken into consideration. Pharmacophore hypotheses were created by ‘tree-based partitioning’ method after selection of 1 A° as terminal box size. All pharmacophore that are mapped into the same box are assumed to be similar enough to ease to identify the common pharmacophore. The 1 A° sized grid box represented a common pharmacophore in that, each of the least required number of active-set molecules were covered. Only boxes survived by the partitioning procedure were kept and others were eliminated. Common Pharmacophore Hypotheses (CPHs) indicating at least five sites (common to all 25 molecules) were considered for the further development. 630 hypotheses were identified. All pharmacophore which were common were scrutinized, and a ‘scoring protocol’ was applied to select the pharmacophore from every surviving grid box. The scoring function offers a grading to the different hypotheses. This allows one to select the reasonable choices towards most fitting hypotheses. Vector and site alignment scores were computed first and used to filter the hypotheses. For filtration, default parameters in PHASE panel were set. ‘Survival inactives’ score was also calculated after obtaining a ‘survival score’ for actives. Further for refinement of hypotheses and minimizing the chance of penalty for matching inactives; rescoring of hypotheses was done. As a result of this, we got post-hoc score. Post-hoc score is nothing but the survival score calculated by a sum of the site, volume, vector, and selectivity scores. Total one hundred fifty-four hypotheses were survived. Hypotheses having post-hoc score more than four (4.0) were further selected for QSAR model generation.
Rationale behind selection of top six hypotheses for QSAR model building and ‘Atom-based 3D QSAR’ method is provided in supplementary material of this article. Before building the QSAR model some parameters were set like; grid spacing size was kept to 1.00 A°; partial least squares (PLS) factor was kept 4. PLS factor was decided on the ground of rule of N/5, where N is the no. of molecules taken in training set [23]. Single best hypothesis was chosen based on the validation parameters (internal and external validation of model) and statistical results obtained. Approved model was utilized for further pharmacophore supported virtual screening.
Validation of 3D QSAR Model
Validation parameters were analyzed for the hypotheses ADDRR.2, ADDRR.4, ADHRR.21, ADHRR.23, ADDHR.49, and ADDHR.14, out of that, ADHRR.21 came up with the best results (Table 2). Internal validation is performed by leave-n-out predictions on the training set by using PLS factor four. This internal cross-validation parameter (R2) can’t provide a reliable and correct forecasting for the ability of QSAR models to give good results on the molecules other than training set. Hence external validation becomes necessary. It is done by few other methods. Q2 (test set) (q2 for the predicted activities) and Pearson, R (the correlation between the predicted and actual activity for test set) were obtained. Another strict requirement for a model acceptance i.e. R0, R’0 & k, k’ were also calculated. R0 (Predicted versus observed activities) and R’0 (observed versus predicted activities) are the coefficients of correlation that obtains by regression lines through the origin with the intercept set to 0. Generally, for a model with good predictive ability R or R’ must be equals to or less than R2. For slope values k (predicted versus observed activities) or k’ (observed versus predicted activities) suitable range is 0.85 ≤ k ≤1.15 or 0.85 ≤k’≤ 1.15 [26, 27].
|
PLS (#) |
sd |
R2 |
F |
p |
RMSE |
Q2 |
Pearson-R |
|
1 |
0.396 |
0.6514 |
33.6 |
3.702e-005 |
0.2573 |
0.4577 |
0.7645 |
|
2 |
0.2408 |
0.8365 |
51.3 |
1.682e-008 |
0.2496 |
0.6156 |
0.7864 |
|
3 |
0.1418 |
0.8403 |
79.7 |
2.025e-011 |
0.1837 |
0.7321 |
0.9004 |
|
4 |
0.109 |
0.8674 |
107.4 |
4.094e-012 |
0.1729 |
0.7432 |
0.9116 |
sd: standard deviation of the regression; R2: regression coefficient; F: variance; p: level of significance variance;
RMSE: root mean square error; Q2: value of q2 for the predicted activities;
Pearson R: correlation between the predicted and observed activity for the test set
Other than above parameters, the robustness of developed model was also checked by Y-randomization (randomization of response) test. This methodology helps to determine the robustness of a selected model and the significance of statistical results obtained. It requires a random scrambling of dependant variable (Y) of the training set molecules to produce new training sets those are dissimilar to the original. The newly produced models, after random shuffling are expected to have less significant correlation coefficient (R2 Y-randomization) values comparative to R2 of the original model and if the reverse is happening then the selected QSAR model cannot be obtained for a specific modeling method and dataset [28]. Scatter graph of observed activity versus predicted activity of the test set molecules was also drawn and analysed.
Results and Discussion
Development and validation of 3D QSAR model
To produce a true 3D QSAR model, that can be further utilized for the ligand-based virtual screening; we have mapped a pharmacophore, based on the previously reported indolin–2–one derivatives as c-KIT inhibitors. After completion of rigorous steps involved in the quest of finding out good common pharmacophore hypothesis (CPH); only six hypotheses i.e. ADDRR.2, ADDRR.4, ADHRR.21, ADHRR.23, ADDHR.49, and ADDHR.14 were considered for building the 3D QSAR model. These six hypotheses were selected by top survival score (≥ 3.8) and post hoc (≥ 4.0). At the PLS factor 4, 3D QSAR models were generated for the above six CPHs. We have analyzed the statistical results of these hypotheses. Among which ADHRR.21 was found to be the best one. ADHRR.21 was granted on the ground of statistical parameters obtained for the internal validation against training set and external validation through test set molecules.
Regression coefficient R2 (0.8674) was high for this model, but as per the suggestion given by A. Golbraikh et al. (2003) [28] this parameter is not only sufficient to explain the robustness of 3D QSAR model. Further other parameters are taken into consideration. Q2 (obtained by leave one/N out method) was also high (0.7432). Q2 is a cross-validated correlation coefficient. More over Q2 parameter is more reliable than the regression coefficient because it is calculated by external validation method on the test set molecules. Standard deviation (sd) of the regression was low (0.109), residual mean square error (RMSE) was in limit (0.1729), Pearson R: correlation coefficient of the test set between the observed and predicted activity, was obtained to be high (0.9116). All statistical results for best model are given in Table 2. Predicted activity of all dataset molecules by ADHRR.21 hypothesis is provided in Table 1. At PLS factor 4, other statistical measurements i.e. R and R’were obtained as 0.8574 and 0.8763 respectively; while k and k’ were obtained as 0.96 and 0.94 respectively. All these parameters were in acceptable range so our model ADHRR.21 has been proved to possess high predictive accuracy for further screening protocol. More over very less residual difference in the observed and predicted activities indicates that we have selected the best 3D QSAR model. ADHRR.21 model along with angles and distances between the sites is given in Fig. 2A & 2B.
Upon QSAR visualization for the active molecules (Fig.3A), it was clearly observed that D3 (H–bond donor feature) is due to the –NH of 2-oxoindoline moiety, A1 (H–bond acceptor feature) is coming from C=O of 2-oxoindoline moiety. H9 (Hydrophobic group) was aligned on the free –CH3 of 2-methyl-4, 5, 6, 7-tetrahydro-1H-indole moiety. Two aromatic rings R11 & R12 were visualized on the benzene ring of 2-oxoindoline and Pyrrole of 2-methyl-4, 5, 6, 7-tetrahydro-1H-indole respectively. Collective effects of (A), (D), (H), (R) and other features were visualized by a QSAR visualization panel of PHASE.
In Fig. 3A, blue cubes indicate favorable features causative to the ligand (actives) interactions with the target while in the Fig. 3B, red cubes indicate unfavorable features from inactives for c-KIT. To our observation, few substitutions like 5-carboxylate, 5-(N, N-diethylsulfamoyl) at the 5th position of 2-oxoindoline moiety and 5-methoxy substitution at the 4th or 7th position of 2-oxoindoline moiety were responsible for unfavorable interactions of those molecules with the active site of c-KIT receptor. Here it could be emphasized that fitness score is a crucial parameter to study the demarcation lines between the active and inactive molecules, because fitness score is an indicative measure of a mapping of pharmacophore site points towards the ligands.
It also measures how well vector characteristics [(A), (H), (N), (D), (P), and (R)] overlays on the hypothesis and how well the conformations superimpose in an overall sense. The regression line equation (observed versus predicted activity) of the combined training & test set molecules was obtained as y = 0.94x + -0.02 (R2 = 0.94) through the scatter graph (Fig. 4).
The Y-randomization test was carried out by shuffling of observed biological activity (pIC50) at 100 random trials for same number of training set molecules every time and same group features. The values of correlation coefficient (R2 Y-randomization) obtained were in the range of 0.08 to 0.4329 and was found to be less than the original correlation coefficient (R2=0.8764) of ADHRR.21. This proves that our model ADHRR.21 was not obtained by mere chance.
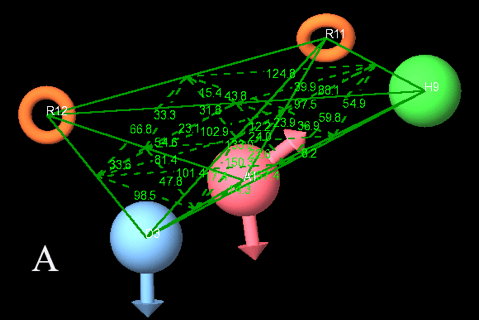
Figure 2A: Angles between the essential Pharmacophoric groups
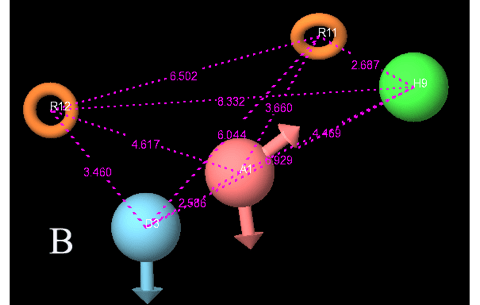
Figure 2B: Distances between the essential Pharmacophoric groups

Figure 3A: Actives from the dataset; Blue cubes showing favorable regions
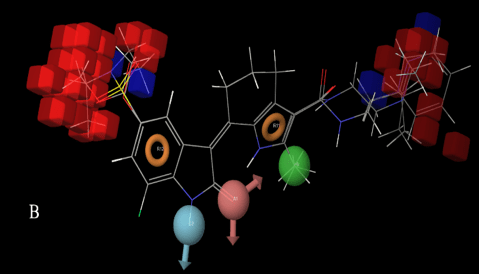
Figure 3B: Inactives from the dataset; Red cubes showing unfavorable regions
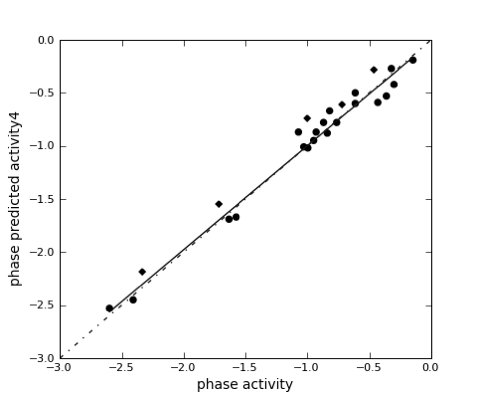
Figure 4: Scatter plot of Training and Test set molecules
Conclusion
Pharmacophore identification and 3D QSAR model development was carried out using series of previously reported indolin–2–ones with well-defined c-KIT inhibitory activity. The common pharmacophore hypothesis (ADHRR.21) was generated comprising five features; two aromatic rings (R) mainly from indolin–2–one and pyrrole, one hydrophobic (H) group (-CH3), one acceptor (A) groups (–C=O) and one donor (D) from –NH of indoline–2–one. The developed 3D QSAR model was able to provide information regarding favorable and unfavorable structural features responsible for c-KIT activity and was found to be statistically significant (R2=0.8764, Q2 =0.7432). Other recommended parameters like R20, R’20 and k, k’ were also measured and found to be within an acceptable range. The model was further validated by external validation methods; Y-randomization.
A c k n o w l e d g e m e n t s
Authors are thankful to Principal, RCPIPER Shirpur, for availing the facility to carry out computational work and his valuable support.
Article Info
Article Type
Research ArticlePublication history
Received: Sat 03, Mar 2018Accepted: Mon 19, Mar 2018
Published: Mon 02, Apr 2018
Copyright
© 2023 Prashant Chaudhari. This is an open-access article distributed under the terms of the Creative Commons Attribution License, which permits unrestricted use, distribution, and reproduction in any medium, provided the original author and source are credited. Hosting by Science Repository.DOI: 10.31487/j.COR.2018.10.004
Author Info
Corresponding Author
Prashant ChaudhariDivision of Computer Aided Drug Design and Discovery, R. C. Patel Institute of Pharmaceutical Education and Research, Shirpur, Dist.-Dhule, Maharashtra, 425 405, India
Figures & Tables
|
Structure |
IC50 (nM) |
Observed pIC50 |
Predicted pIC50 |
||
|
R1 |
R2 |
||||
|
b1. |
H |
NH(CH2)2N(CH2CH3)2 |
11.7 |
-1.072d |
-0.97 |
|
a2. |
5-F |
NH(CH2)2N(CH2CH3)2 |
2.4 |
-0.38d |
-0.49 |
|
b3. |
5-Cl |
NH(CH2)2N(CH2CH3)2 |
2.7 |
-0.431d |
-0.59 |
|
b4. |
5-Br |
NH(CH2)2N(CH2CH3)2 |
2.3 |
-0.362d |
-0.43 |
|
b5. |
5-CH3 |
NH(CH2)2N(CH2CH3)2 |
4.1 |
-0.613d |
-0.60 |
|
a6. |
5-OCH3 |
NH(CH2)2N(CH2CH3)2 |
35.5 |
-1.55c |
-1.52 |
|
b7. |
5-NO2 |
NH(CH2)2N(CH2CH3)2 |
6.9 |
-0.839d |
-0.88 |
|
b8. |
5-COOCH3 |
NH(CH2)2N(CH2CH3)2 |
255.7 |
-2.408c |
-2.41 |
|
b9. |
5-SO2N(CH2CH3)2 |
NH(CH2)2N(CH2CH3)2 |
397.6 |
-2.599c |
-2.55 |
|
b10. |
4-F |
NH(CH2)2N(CH2CH3)2 |
43.1 |
-1.634c |
-1.69 |
|
a11. |
7-F |
NH(CH2)2N(CH2CH3)2 |
180.8 |
-2.257c |
-2.16 |
|
b12. |
5-F |
NH(CH2)2-morpholin-4-yl |
2 |
-0.301d |
-0.42 |
|
b13. |
5-F |
NH(CH2)2-piperidin-1-yl |
5.8 |
-0.763d |
-0.78 |
|
b14. |
5-F |
NH(CH2)2-pyrrolidin-1-yl |
7.4 |
-0.869d |
-0.78 |
|
b15. |
5-F |
NH(CH2)2N(CH3)2 |
6.6 |
-0.82d |
-0.92 |
|
b16. |
5-F |
NH(CH2)2OH |
1.4 |
-0.146d |
-0.19 |
|
b17. |
5-F |
NH(CH2)2-pyridin-2-yl |
37.7 |
-1.576c |
-1.67 |
|
b18. |
5-F |
NH(CH2)3N(CH2CH3)2 |
9.9 |
-0.996d |
-1.02 |
|
a19. |
5-F |
NH(CH2)3-morpholin-4-yl |
5.7 |
-0.756d |
-0.77 |
|
b20. |
5-F |
NH(CH2)3-pyrrolidin-1-yl |
10.7 |
-1.029d |
-1.01 |
|
b21. |
5-F |
NHCH2CH(OH)CH2N(CH2CH3)2 |
4.1 |
-0.613d |
-0.60 |
|
b22. |
5-F |
Morpholin-4-yl |
2.1 |
-0.322d |
-0.37 |
|
a23. |
5-F |
IMAGE |
7.8 |
-0.892d |
-0.85 |
|
b24. |
5-F |
IMAGE |
8.5 |
-0.929d |
-0.89 |
|
b25. |
Sunitinib _ _ |
8.9 |
-0.949d |
-0.95 |
|
References
1. Zsebo KM, Williams DA, Geissler EN, Broudy VC, Martin FH, et al. (1990) Stem cell factor is encoded at the SI locus of the mouse and is the ligand for the c-kit tyrosine kinase receptor. Cell 63: 213-224. [Crossref]
2. Isakov N, Biesinger B (2000) Lck protein tyrosine kinase is a key regulator of T-cell activation and a target for signal intervention by Herpesvirus saimiri and other viral gene products. Eur J Biochem 267: 3413-3421. [Crossref]
3. Drube S, Schmitz F, Gopfert C, Weber F, Kamradt T (2012) C-Kit controls IL-1β-induced effector functions in HMC-cells. Eur J Pharmacol 675: 57-62.
4. Robert R Jr (2005) Signaling by Kit protein-tyrosine kinase: The stem cell factor receptor. Biochem Bioph Res Co 337: 1-13. [Crossref]
5. Kansal N, Silakari O, Ravikumar M (2010) Three-dimensional pharmacophore modelling for c-Kit receptor tyrosine kinase inhibitors. Eur J Med Chem 45:3 93-404. [Crossref]
6. Wang WL, Healy ME, Sattler M, Verma S, Lin J, et al. (2000) Growth inhibition and modulation of kinase pathways of small cell lung cancer cell lines by the novel tyrosine kinase inhibitor STI 571. Oncogene 19: 3521-3528. [Crossref]
7. Heinrich MC, Blanke CD, Druker BJ, Corless CL (2002) Inhibition of KIT tyrosine kinase activity: a novel molecular approach to the treatment of KIT-positive malignancies. J Clin Oncol 20: 1692-1703. [Crossref]
8. Imai K, Takaoka A (2006) Comparing antibody and small-molecule therapies for cancer. Nat Rev Cancer 6: 714-727. [Crossref]
9. Eklund KK (2007) Mast cells in the pathogenesis of rheumatic diseases and as potential targets for anti-rheumatic therapy. Immunol Rev 217: 38-52. [Crossref]
10. Jensen BM, Metcalfe DD, Gilfillan AM (2007) Targeting kit activation: a potential therapeutic approach in the treatment of allergic inflammation. Inflamm Allergy Drug Targets 6: 57-62.
11. Chen N, Burli RW, Neira S, Hungate R, Zhang D, et al. (2008) Discovery of a potent and selective c-Kit inhibitor for the treatment of inflammatory diseases. Bioorg Med Chem Lett 18: 4137-4141.
12. Gajiwala KS, Wu JC, Christensen J, Deshmukh GD, Diehl W, et al. (2009) KIT kinase mutants show unique mechanisms of drug resistance to imatinib and sunitinib in gastrointestinal stromal tumor patients. Proc Natl Acad Sci USA 106: 1542-1547. [Crossref]
13. Zhang L, Zheng Q, Yang Y, Zhou H, Gong X, et al. (2014) Synthesis and in vivo SAR study of indolin-2-one-based multi-targeted inhibitors as potential anticancer agents. Eur J Med Chem 82: 139-151. [Crossref]
14. Cho TP, Dong SY, Jun F, Hong FJ, Liang YJ, et al. (2010) Novel Potent Orally Active Multitargeted Receptor Tyrosine Kinase Inhibitors: Synthesis, Structure-Activity Relationships, and Antitumor Activities of 2-Indolinone Derivatives. J Med Chem 53: 8140-8149. [Crossref]
15. Almerico AM, Tutone M, Lauria A (2012) Receptor-guided 3D-QSAR approach for the discovery of c-kit tyrosine kinase inhibitors. J Mol Model 18: 2885–2895. [Crossref]
16. Pan Y, Wang Y, Bryant SH (2013) Pharmacophore and 3D-QSAR Characterization of 6-Arylquinazolin- 4-amines as Cdc2-like Kinase 4 (Clk4) and Dual Specificity Tyrosine-phosphorylation-regulated-Kinase 1A (Dyrk1A) Inhibitors. J Chem Inf Model 53: 938-947. [Crossref]
17. Cruciani G, Watson KA (1994) Comparative molecular field analysis using GRID force-field and GOLPE variable selection methods in a study of inhibitors of glycogen phosphorylase b. J Med Chem 37: 2589-2601.
18. Ballante F, Ragno R (2012) 3-D QSAutogrid/R: An alternative procedure to build 3-D QSAR models. Methodologies and applications. J Chem Inf Model 52: 1674-1685. [Crossref]
19. Ding L, Tang F, Huang W, Jin Q, Shen H, et al. (2013) synthesis, and biological evaluation of novel 3-pyrrolo[b]cyclohexylene-2-dihydroindolinone derivatives as potent receptor tyrosine kinase inhibitors. Bioorg Med Chem Lett 23: 5630-5633
20. Dixon SL, Smondyrev AM, Knoll EH, Rao SN, Shaw DE, et al. (2006) PHASE: a new engine for pharmacophore perception, 3D QSAR model development, and 3D database screening: 1. Methodology and preliminary results. J Comput Aided Mol Des 20: 647-671. [Crossref]
21. Dixon SL, Smondyrev AM, Rao SN (2006) PHASE: a novel approach to pharmacophore modeling and 3D database searching. Chem Biol Drug Des 67: 370-372. [Crossref]
22. Golbraikh A, Shen M, Xiao Z, Xiao Y, Lee K, et al. (2003) Rational selection of training and test sets for the development of validated QSAR models. J Comput Aided Mol Des 17: 241-253. [Crossref]
23. Teli MK, Rajanikant GK (2012) Pharmacophore generation and atom-based 3D-QSAR of N-iso-propyl pyrrole-based derivatives as HMG-CoA reductase inhibitors. Org Med Chem Lett 2: 1-10. [Crossref]
24. Shah UA, Deokar HS, Kadam SS, Kulkarni VM (2010) Pharmacophore generation and atom-based 3D-QSAR of novel 2-(4-methylsulfonylphenyl) pyrimidines as COX-2 inhibitors. Mol Diversity 14: 559-568. [Crossref]
25. Golbraikh A, Tropsha A (2002) Beware of q2! J Mol Graph Model 20: 269-276. [Crossref]
26. Zhang S, Golbraikh A, Oloff S, Kohn H, Tropsha A (2006) J Chem Inf Model 46: 1984-1995.
27. Melagraki G, Afantitis A (2013) Enalos KNIME nodes: Exploring corrosion inhibition of steel in acidic medium. Chemometr Intell Lab 123: 9-14.
28. Guner O, Henry D (1998) Formula for determining the “goodness of hit lists” in 3D database searches. Accelrys/MDL Information Systems, Inc., San Diego/San Leandro, At URL http://www.netsci.org/Science/Cheminform/feature09.html