Utility of Mitral Leaflet Separation Index (Mlsi) For Assesing Severity of Mitral Stenosis Before and After Percutaneous Trnansmitral Commisurotomy(Ptmc)
A B S T R A C T
Background: A novel index called the mitral leaflet separation index (MLS index) has shown to be useful in assessing the severity of Mitral Stenosis (MS). However, studies on use of MLS index in assessing severity of mitral stenosis in post PTMC setting is limited
Aims: To study correlation of MLSI with severity of mitral stenosis by various method on echocardiography and catheterization in both pre PTMC and post PTMC setting.
Methods: Consecutive patients of all ages and both sexes with moderate to severe rheumatic mitral stenosis who underwent successful PTMC from January 2014 to December 2015 were included in the study. The mitral valve area (MVA) was estimated by the standard 2D echo planimetry and pressure halftime methods. The MLS index was estimated by measuring the maximal separation of tip of the mitral leaflets in end diastole in parasternal long axis (PLAX) view and in apical 4-chamber view (A4C). The MS severity was also assessed by calculating the MVA using Gorlin's Formula during cardiac catheterization study. Correlation between MLSI and hemodynamic severity of MS by conventional echocardiography and catheterization was studied.
Results: 50 patients with moderate or severe mitral stenosis and valve morphology favourable for PTMC were included in the study. The male-to female ratio is 1: 2.33. The mean age of the patients was 30.64 + 10.62 years. Pre-PTMC, the mean MVA by PHT method was 0.749 + 0.12 cm2 while the mean MVA by 2D method was 0.77 + 0.23cm2. The mean MV pressure gradient was 14.93 + 1.93mmHg and the mean MLSI was 6.606 + 1.5 mm. Mean MVA (Gorlin) was 0.735 + 0.1 cm2. MLS index correlated well with MVA by planimetry method both in pre-PTMC (r = 0.635; p = <0.0001) and post-PTMC patients (r = 0.49; p = 0.0004) and overall correlation was r = 0.92 with p < 0.0001
Keywords
Mitral separation index(Mlsi), mitral stenosis, percutaneous trnansmitral commisurotomy(Ptmc)
Introduction
Mitral stenosis (MS), an obstruction to blood flow between the left atrium (LA) and the left ventricle (LV), is caused by abnormal mitral valve function. The predominant cause of MS is rheumatic fever, with rheumatic changes present in 99% of stenotic mitral valves excised at the time of mitral valve (MV) replacement. Echocardiography, has emerged as the gold standard for clinical characterization of valvular lesions. The severity of MS is commonly estimated by 2D Echo planimetry method, Doppler pressure half time (PHT) estimation and by pressure gradient across mitral valve. Planimetry method of estimation of mitral valve area(MVA), may be difficult in patients who have heavy calcification or who previously had commissurotomy [1, 2]. Doppler imaging provides a reliable quantitative and hemodynamic data about the severity of MS. Because velocity and pressure gradient depend on volume of flow across the mitral valve, these factors may not always be reliable predictors of severity [3]. A simple, novel index called the mitral leaflet separation index (MLS index) has shown to be useful in assessing the severity of MS [4]. The MLS index is estimated by measuring the maximal separation of tip of the mitral leaflets in end diastole in parasternal long axis (PLAX) view and in apical 4-chamber view (A4C view). MLS index , in various studies has demonstrated an excellent correlation with MVA by planimetry and the pressure half-time method in pre PTMC (percutaneous transvenous mitral commissurotomy )setting [5-8]. However, studies on use of MLS index in assessing severity of mitral stenosis in post PTMC setting is limited. Few studies, studying the role of MLSI in the post-PTMC setting, has shown correlation between MLSI and MVA by planimetry only [5, 9]. There is lack of data on correlation of MLSI with MVA by PHT or pressure gradient across mitral valve in post PTMC setting. so, this study has been undertaken to study correlation of MLSI with severity of mitral stenosis by various method on echocardiography and catheterization in both pre PTMC and post PTMC setting.
Materials & Methods
The study has been conducted in the department of cardiology, Gauhati Medical College & Hospital from January 2014 to December 2015.Consecutive patients of all ages and both sexes with moderate to severe rheumatic mitral stenosis who underwent successful PTMC were taken up under the study. The mitral valve area was estimated by the standard 2D echo planimetry and pressure halftime methods. The MLS index was estimated by measuring the maximal separation of tip of the mitral leaflets in end diastole in parasternal long axis (PLAX) view and in apical 4-chamber view (A4C) [4]. For patients in sinus rhythm, three measurements were obtained in PLAX and A4C view each. A mean of this was taken as MLS index. For patients in Atrial fibrillation, five measurements were taken in PLAX view and five measurements in A4C view. A mean of this was considered as the MLS index. MLS index was compared with MVA assessed by planimetry and PHT. Severe MS was defined as MVA of 1 cm2 or less by planimetry or pressure half-time. Moderate MS was defined as MVA between 1 cm2 and 1.5 cm2 by planimetry or pressure half-time method. The MS severity will also be assessed by calculating the MVA using Gorlin's Formula during cardiac catheterization study. Correlation between MLSI and hemodynamic severity of MS by conventional echocardiography and catheterization was studied.
Statistical Analysis
Linear regression analysis was used to correlate MLSI against MVA by planimetry, PHT and Gorlin's method. Statistical analysis was done using Microsoft Excel and Graphpad software.
Results
50(fifty) consecutive patients of rheumatic heart disease with moderate or severe mitral stenosis and valve morphology favourable for PTMC were included in the study. Of 50 patients studied, 15 patients (30%) were male and 35 patients (70%) were females with a male-female ratio of 1: 2.33. The mean age of the patients was 30.64 + 10.62 years, of which 11 patients (22%) were younger than 20 years . Pre-PTMC, the mean MVA by PHT method was 0.749 + 0.12 cm2 while the mean MVA by 2D method was 0.77 + 0.23cm2. The mean MV pressure gradient was 14.93 + 1.93mmHg and the mean MLSI was 6.606 + 1.5 mm. Mild MR was present in 12 patients (24%) and the average TR gradient was 47.86 + 16.31 mmHg. Mean MVA (Gorlin) was 0.735 + 0.1 cm2.
Post-PTMC, the mean MVA by PHT method was 1.55+ 0.31 cm2 while the mean MVA by 2D method was 1.85 + 0.30cm2. The mean MV pressure gradient was 3.92 + 1.02 mmHg and the mean MLSI was 10.8 + 1.05mm. Moderate MR was present in 3 patients (6%) and the average TR gradient was 26.5 + 7.6 mmHg.
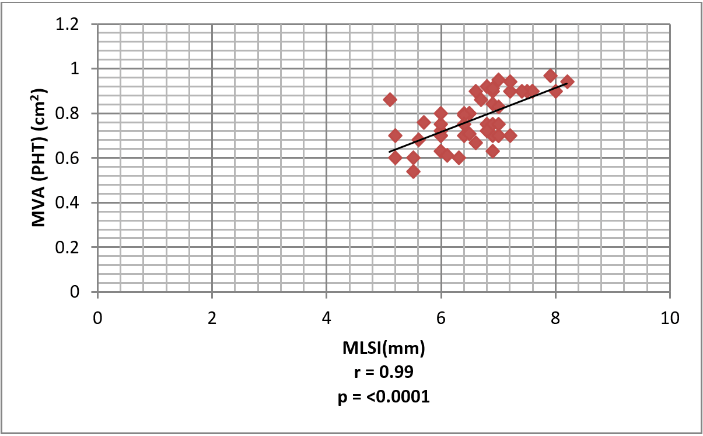
Figure 1: Correlation between MLSI and MVA by PHT method in Pre-PTMC patients. The mean MLSI in patients before PTMC was 6.606 + 1.5 mm, while the mean MVA by PHT method was 0.749 + 0.12 cm2. An excellent correlation was seen between MLSI and MVA by PHT method with r = 0.99 (p = <0.0001) in these patients.
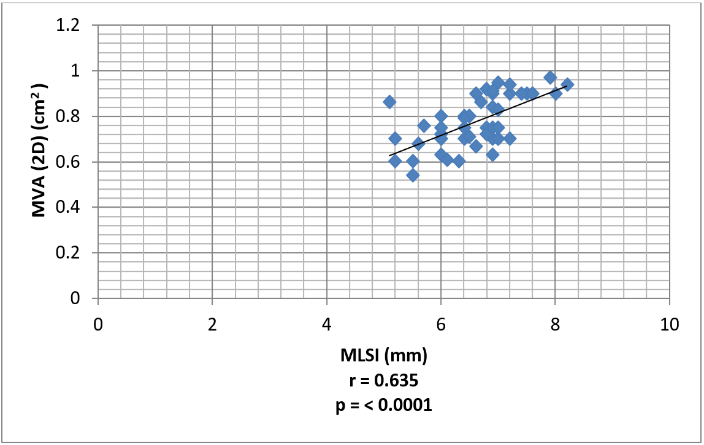
Figure 2: Correlation between MLSI and MVA by 2D method in Pre-PTMC patients. Pre-PTMC, the mean MVA by 2D method was 0.77 + 0.23cm2. A strong correlation with a r = 0.635 (p=<0.0001) was also seen between MLSI and MVA by 2D method in Pre-PTMC patients.
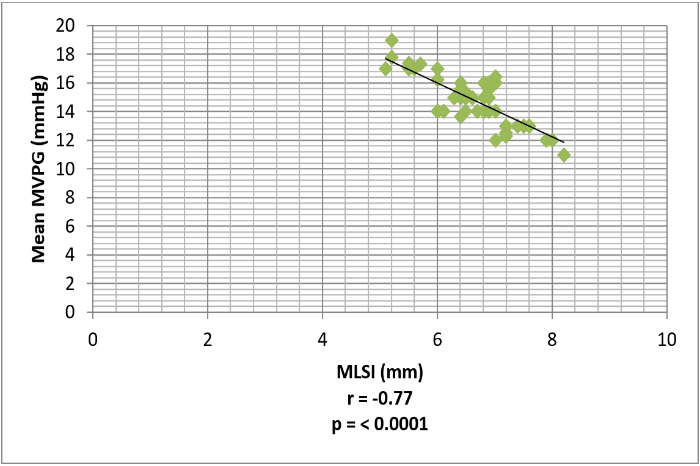
Figure 3: Correlation between MLSI and Mean MVPG in Pre-PTMC patients. Pre-PTMC, the mean MV pressure gradient was 14.93 + 1.93mmHg. There was a strong inverse correlation between MLSI and Mean Mitral Valve gradient in Pre-PTMC patients (r=-0.77; p=<0.0001).
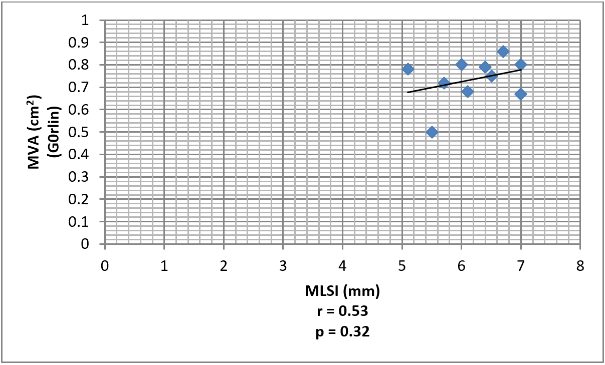
Figure 4: Correlation between MLSI and MVA by Gorlin's method in Pre-PTMC patients. The correlation between MLSI and MVA by Gorlin's method was found to be good (r=0.53; p = 0.32) although it was statistically insignificant.
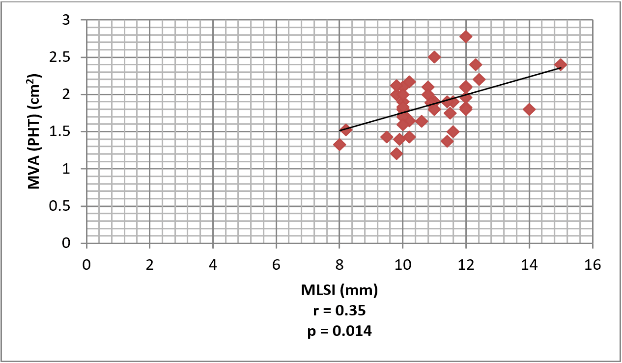
Figure 5: Correlation between MLSI and MVA by PHT method in Post-PTMC patients. The correlation between MLSI and MVA by PHT method in Post-PTMC patients was significantly weak (r=0.35; p=0.014).
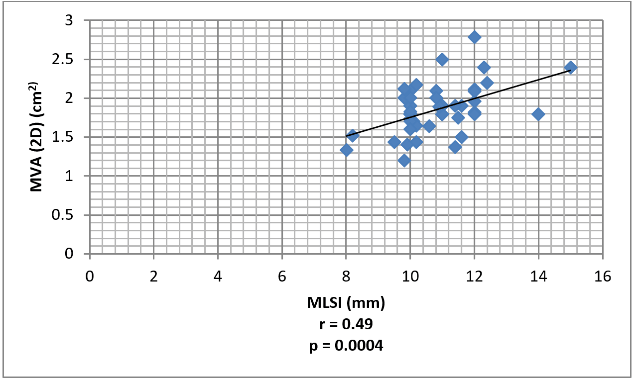
Figure 6: Correlation between MLSI and MVA by2D method in Post-PTMC patients. There was a strong correlation between MLSI and MVA by2D method in Post-PTMC patients (r=0.49; p=0.0004).
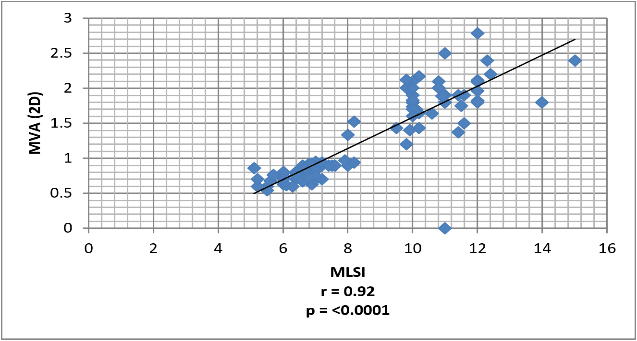
Figure 7: Correlation between MLSI and MVA (2D) in both pre-PTMC and post-PTMC patients. Overall, there was excellent correlation. between MLSI and MVA (2D) in both pre-PTMC and post-PTMC patients (r = 0.92; p = <0.0001).

Figure 8: Correlation between MLSI and Mean Mitral Valve gradient in Post-PTMC patients. There was a weak inverse correlation between MLSI and Mean Mitral Valve gradient in Post-PTMC patients (r=-0.08; p=0.58) although it was statistically insignificant.
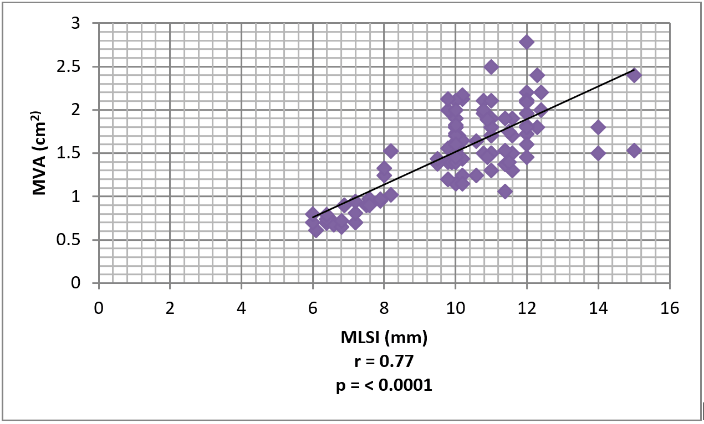
Figure 9: Correlation between MLSI and MVA in presence of MR. In patients with combined mitral valve disease, the correlation between MLSI and MVA was also strong (r=0.77; p=<0.0001.
Discussion
In this study, we evaluate the role of mitral leaflet separation index (MLSI) in assessing severity of mitral stenosis and its correlation with the mitral valve area (MVA) as determined by trans-thoracic echocardiography (PHT and 2D) and cardiac catheterization (Gorlin's method) in both pre PTMC and post PTMC setting. In our study we found that MLS index measured by 2D echocardiography is an accurate and reliable measure to estimate the severity of mitral stenosis and correlated well with MVA by planimetry method both in pre-PTMC (r = 0.635; p = <0.0001) and post-PTMC patients (r = 0.49; p = 0.0004) and overall correlation was r = 0.92 with p < 0.0001. This is comparable to those reported by Holmin et al. (r=0.74; p<0.0001), Vimal Raj BS et al (r=0.87; p<0.0001), Younan et al (r=0.809; <0.001) and JK Thomas et al. (r=0.82; < 0.001) [5-8]. In the present study, in pre-PTMC patients, an excellent correlation was seen between MLSI and MVA by PHT method with r = 0.99 (p <0.0001). In pre-PTMC patients, the correlation between MLSI and MVA (PHT) is comparable to other studies done by Vimal Raj BS et al. (r=0.86; p<0.0001), Younan et al. (r=0.809; p<0.001) and JK Thomas et al. 2011(r=0.866; p<0.0001) [7, 8].
In our study, there was a strong correlation between MLSI and MVA by 2D method in Post-PTMC patients (r=0.49; p=0.0004), but the correlation between MLSI and MVA by PHT method in Post-PTMC patients was significantly weak (r=0.35; p=0.014).In post PTMC measurement of MVA by PHT is unreliable, hence we found a weak correlation, however since we found a strong correlation between MLSI and MVA by 2D method in Post-PTMC patients, we can conclude that even in post PTMC, MLSI is helpful. There are limited studies which studied the correlation between MLSI and MVA in the post-PTMC setting. C. Holmin et al. and B Duggal et al. has shown good correlation between MLSI and MVA by planimetry only [5, 9].
In this study, a strong inverse correlation between MLSI and Mean Mitral Valve gradient was observed in Pre-PTMC patients (r=-0.77; p=<0.0001). But there was a weak inverse correlation between MLSI and Mean Mitral Valve pressure gradient in Post-PTMC patients (r=-0.08; p = 0.58) although it was statistically insignificant. This is comparable to the study in mitral stenosis patients by JK Thomas et al where there was a strong inverse correlation of the cuspal separation (r = -0.52) with mean gradient [8]. But there is no study in which the correlation between MLSI and Mean MVPG in the post-PTMC setting has been studied.
In the present study, the correlation between MLSI and MVA by Gorlin's method was found to be good (r=0.53; p = 0.32) although it was statistically insignificant. Similar correlation between MLSI and MVA by Gorlin's method has been shown by B Duggal et al In the present study, among patients with combined mitral valve disease, the correlation between MLSI and MVA was also strong (r=0.77; p=<0.0001). This is comparable to the finding by JK Thomas et al in which a significant correlation (r = 0.83) was seen between MVA and cuspal separation in presence of MR [8, 9].
Limitation of study
There are some limitations in the present study. This is an observational study and it cannot replace the results of a randomized controlled study. The total number of patients is only fifty and in only ten patients, cardiac catheterization was done to estimate the MVA by Gorlin's method. Also, the role of MLSI in patients with atrial fibrillation was not assessed.
Conclusion
Mitral leaflet separation index (MLSI) ,measured by 2D echocardiography is an accurate ,simple and reliable measure to study the severity of mitral stenosis and can be used as an adjunct to planimetry or PHT to study severity of mitral stenosis in both pre PTMC and post PTMC setting.
Article Info
Article Type
Research ArticlePublication history
Received: Wed 28, Aug 2019Accepted: Mon 07, Oct 2019
Published: Mon 25, Nov 2019
Copyright
© 2023 Farhin Iqbal. This is an open-access article distributed under the terms of the Creative Commons Attribution License, which permits unrestricted use, distribution, and reproduction in any medium, provided the original author and source are credited. Hosting by Science Repository.DOI: 10.31487/j.JICOA.2019.03.07
Figures & Tables
References
- Mensah GA (2009) The burden of valvular heart disease. In: Otto CM, Bonow RO, ed. Valvular Heart Disease: A Companion to Braunwald's Heart Disease, Philadelphia: Saunders/Elsevier 2009: 118.
- Abascal VM, Wilkins GT, Choong CY, Thomas JD, Palacios IF et al. (1988) Echocardiographic evaluation of mitral valve structure and function in patients followed by for at least 6 months after percutaneous balloon mitral valvuloplasty. J Am Coll Cardiol 12: 606-615. [Crossref]
- Faletra F, Pezzano A Jr, Fusco R, Mantero A, Corno R et al. (1996) Measurement of mitral valve area in MS: Four echocardiographic methods compared with direct measurement of anatomic orifices. J Am Coll Cardiol 28: 1190-1197. [Crossref]
- Fisher ML, Parisi AF, Plotnick GD, DeFelice CE, Carliner NH et al. (1979) Assessment of severity of mitral stenosis by echocardiographic leaflet separation. Arch Intern Med 139: 402-406. [Crossref]
- Holmin C, Messika-Zeitouna D, Mezalek AT, Brochet E, Himbert D et al. (2007) Mitral Leaflet Separation Index: A new method for the evaluation of the severity of mitral stenosis? Usefulness before and after percutaneous mitral commisurotomy. J Am Soc Echocardiogr 20: 1119-1124. [Crossref]
- Vimal Raj BS, George P, Jose VJ (2008) Mitral leaflet separation index-A simple novel index to assess the severity of mitral stenosis. Indian Heart J 60: 563-566. [Crossref]
- Hany Younan (2010) Usefulness of 2-Dimensional Mitral Valve Leaflets Separation Index as a New Technique for Assessment of Mitral Stenosis Severity: Comparison with Planimetry and PHT Methods. Egypt Heart J 62: 187-195.
- Thomas JK, Anoop TM, Sebastian BG, George k, George R (2011) Mitral leaflet separation index in assessing the severity of mitral stenosis. ISRN Cardiol 2011: 768097. [Crossref]
- Duggal B, Bajaj M, Prabhu S, Mathew T (2012) The Mitral Leaflet Separation Index for Assessment of Mitral Stenosis During Percutaneous Mitral Commissurotomy: Validation of the Index in the Immediate Post-Pmc Period. Echocardiography 29: 1143-1148. [Crossref]