Feasibility of Using eGFR to Diagnose Contrast-Induced Nephropathy in Patients Undergoing Coronary Angiography
A B S T R A C T
Background: Contrast-induced nephropathy (CIN) is one of the common complications of coronary angiography (CAG). The changes of serum creatinine (Scr) before and after angiography were used to diagnose CIN in the world. But Scr is not a sensitive index to reflect early renal dysfunction. Estimated glomerular filtration rate (eGFR) is a comprehensive indicator to evaluate renal function but does not have accepted standard to diagnose CIN till now. This study aimed to investigate the feasibility of using eGFR to diagnose CIN in patients undergoing CAG.
Methods: We included 300 coronary heart disease (CHD) patients who underwent CAG. Their demographics and basal renal function were recorded. Changes of Scr and eGFR before and after CAG were compared at the same time. Logistic regression was used to find independent influence factors of CIN. Receptor operating characteristic (ROC) curve was used to find the optimum cut-off value of eGFR for diagnosing CIN.
Results: Among 300 patients with CHD, 64 (41 males and 23 females) of them were affected by CIN after CAG, with a total incidence of 21.3%. Among 271 patients whose Scr were normal (< 133 μmol/L) before CAG, 109 (40.2%) of them with impaired eGFR (< 90 ml/min/1.73m²). Patients had normal eGFR before CAG were less likely to develop CIN than those with normal Scr (15.4% vs 20.7%, P < 0.05). Logistic regression analysis showed that men, diabetes, multivessel lesion and eGFR were independent factors of CIN. ROC curve showed that the optimum cut-off value for diagnosing CIN was eGFR decrease by 22.5% after CAG (sensitivity = 98.4%, specificity = 98.3%, AUC = 0.973, 95%CI: 0.942-1.000, P = 0.000).
Conclusions: eGFR is an independent factor of CIN, which is more sensitive than Scr in reflecting early renal dysfunction. Using eGFR to diagnose CIN is feasible in the clinic, but the cut-off value still needs to be confirmed by large scale clinical trials.
Keywords
Contrast-induced nephropathy, serum creatinine, glomerular filtration rate
Introduction
Coronary heart disease (CHD) has become the leading cause of death worldwide [1-2]. Coronary angiography (CAG) is the gold standard in the diagnosis of CHD [3]. Although the use of hypotonic non-ionic contrast agents can reduce renal damage, contrast-induced nephropathy (CIN) has significantly increased in recent years because of CAG being widely promoted. It is reported that about 4.4-11.3% of patients undergoing CAG will develop CIN, depending on populations, baseline risk factors and definitions [4-6].
The changes of serum creatinine (Scr) before and after CAG were used to diagnose CIN in the clinic [7]. However, Scr is not a perfect marker to reflect early renal dysfunction, because of its low sensitivity [8-10]. Before any Scr increase can be observed, more than 50% of glomerular filtration rate (eGFR) reduction occurr [11]. Thus, Scr to diagnose CIN may delay the optimal treatment time. Although eGFR is a sensitive index for early renal impairment, there is no specific standard to diagnose CIN by eGFR in the world till now. In this study, we aimed to investigate the feasibility of using eGFR to diagnose CIN and try to find out an optimum value.
Methods
I Study Design and Data Collection
This was a single-center observational, descriptive and analytical study that retrospectively analyzed the hospital record of a historical cohort of patients who underwent CAG between January 2015 and December 2016 in the People's Hospital of Xinyi. Patients with malignant tumors, obstructive nephropathy, renal artery stenosis, renal toxic medicine intake, hepatic diseases, and baseline renal function stage more than III, according to Scr, were excluded. Ethics Committees in Sun Yat-sen Memorial Hospital and People's Hospital of Xinyi approved this study.300 patients undergoing CAG were included in our study. By checking the electronic database of patients’ medical records, data of demographic, clinical, and laboratory test before and after CAG were collected. eGFR was calculated retrospectively using the simplified MDRD formula [eGFR=186×(Scr)-1.154×(Age)-0.203×(0.742 if female)] [12, 13]. Changes of Scr and eGFR before and after CAG were compared at the same time.
II Definitions
CIN was diagnosed according to the K/DIGO guideline, which is the latest criteria. CIN was defined as an acute decrease in renal function after the exposure to contrast media, characterized by an absolute increase of ≥ 44.2 umol/L (≥ 0.5mg/dl) or ≥ 25% in Scr compared with baseline in the subsequent 48-72h, not explained by other causes [14]. Hypertension can be diagnosed by measuring SBP ≥ 140mmHg and/or DBP ≥ 90mmHg three times on different days without using antihypertensive drugs, or a history of hypertension diagnosis. Diabetes is defined as fasting blood glucose equal to or greater than 7.0 mmol/L, or decreased blood glucose with medication, or a history of diabetes diagnosis. Stroke is defined as cerebral infarction and/or cerebral hemorrhage with a history of more than 3 months. Heart failure included cardiac function NYHA or Killip class II ~ IV. Multivessel lesions indicated by CAG confirmed stenosis of at least two vessels in the left main coronary artery, left anterior descending branch, left circumflex branch and right coronary artery with stenosis of 70%.
III Cardiac Catheterization with CAG
Cardiac catheterizations with selective CAG were performed with standard techniques [15]. The results were recorded in both standard reports and digital imaging. Two interventional cardiologists who were unaware of the characteristics clinical, evaluated the CAG images independently. Both the anatomic feathers and the Gensini score were recorded.
IV Statistical Analysis
The normal-distributed quantitative data were expressed as mean value ± standard deviation and compared using the Students t test. Otherwise, median (25th~75th) was used and compared with Mann-Whitney U test. Categorical data were presented as absolute values and percentages and compared using chi square or Fishers exact test. Logistic regression model (enter), univariate and multivariate analyses were used to compare demographic, clinical and echocardiographic parameters to CIN. All variables in univariate analysis with P value < 0.20 entered multivariate analysis. The variables with P value < 0.05 were in the final model. Receptor operating characteristic (ROC) curve was used to find the optimum cut-off value of eGFR for diagnosing CIN. The SPSS software package for Windows 22 (IBM Corporation, New York, USA) was used for all statistical analysis. The significance was established at 2-tailed P < 0.05.
Results
I Baseline Characteristics of Study Population
As shown in (Table 1), a total of 300 patients were enrolled, including 223 (74.3%) males and 77 (25.7%) females. After a case-by-case analysis and a precise application of the CIN definition, 64 (41 males and 23 females) of them were affected by CIN after CAG, with a total incidence of 21.3%. In the CIN group, diabetes mellitus, emergency intervention, heart failure, multivessel lesion, baseline glucose level, and NT-proBNP were significantly higher than those in the non-CIN group, while the number of male patients, the levels of albumin, rehydration therapy rate and eGFR were lower than those in non-CIN group (P <0.05, Table 1). There were no significant differences in age, body mass index, hypertension, stroke, hematocrit, dosage of contrast agent, blood lipid and biochemical indexes between CIN group and non-CIN group.
II Scr and eGFR to Assess Early Renal Function
i Analysis of eGFR Levels in Patients with Normal Scr
There were 271 patients (90.3%) whose Scr were normal (< 133 μmol/L) before CAG. However, 109 (40.2%) of them had impaired eGFR (eGFR < 90 ml/min/1.73 m2). It suggests that Scr is not a sensitive marker of early renal impairment compared with eGFR.
ii Comparison of Postoperative CIN in Patients with Normal Scr and Normal eGFR
Among 271 patients whose Scr were normal (< 133 μmol/L) before CAG, 56 (20.7%) of them develop CIN. Among 162 patients whose eGFR were normal (more than 90 ml/min/1.73 m2) before CAG, there were only 25 (15.4%) of them develop CIN. Patients with normal eGFR before CAG were less likely to develop CIN than those with normal Scr (P < 0.05, Table 2).
III eGFR is an Independent Indicator of CIN
Logistics regression analysis was used to find the independent influencing factors of CIN. It showed that men and eGFR were protective factors for CIN, while diabetes and multivessel lesion were risk factors for CIN (Table 3).
IV The Optimum Cut-off Value of eGFR to Diagnose CIN
The ROC curve showed that the optimum cut-off value for diagnosing CIN was the decrease in eGFR by 22.5% after CAG (sensitivity = 98.4%, specificity = 98.3%, AUC = 0.973, 95%CI: 0.942-1.000, P = 0.000, (Figure 1A). Also, we tried to find out if the absolute value of eGFR decrease will be more suitable than the relative value of decrease in diagnosing CIN. The ROC curve showed that the optimum cut-off value for diagnosing CIN was the absolute decrease in eGFR by 15.6 ml/min/1.73m² after CAG (sensitivity = 89.1%, specificity = 86.9%, AUC = 0.934, 95%CI: 0.898-0.971, P = 0.000, Figure 1B). Thus, using the relative changes of eGFR to diagnose CIN is better than using absolute changes.
Table 1: Demographic and clinical characteristics of the study population, according to development of CIN.
|
Male,n(%) |
182(77.1%) |
41(64.1%) |
0.010 |
|
Age, (years) |
63.1±11.2 |
64.8±9.5 |
0.141 |
|
BMI,(Kg/m2) |
24.2±2.9 |
24.4±3.3 |
0.333 |
|
Hypertension,n(%) |
122(51.7%) |
33(51.6%) |
0.110 |
|
Diabetes,n (%) |
29(12.3%) |
15(23.4%) |
0.010 |
|
Stroke,n (%) |
21(8.90%) |
7(10.9%) |
0.160 |
|
Emergent intervention,n (%) |
52(22.0%) |
22(34.4%) |
0.020 |
|
Heart failure,n (%) |
154(65.3%) |
49(76.6%) |
0.030 |
|
Multivessel lesion,n (%) |
183(77.5%) |
55(85.9%) |
0.050 |
|
Hematocrit,n (%) |
41.0±6.5 |
40.2±6.6 |
0.194 |
|
Contrast agent dose, (ml) |
126.8±61.9 |
131.3±60.6 |
0.305 |
|
Rehydration therapy,n (%) |
185(78.4%) |
43(67.2%) |
0.020 |
|
Albumin,(g/L) |
40.3±3.8 |
38.9±4.9 |
0.009 |
|
BUN,(mmol/L) |
5.98±2.69 |
6.04±2.90 |
0.441 |
|
Serum creatinine,(μmol/L) |
87.5±49.4 |
92.4±28.3 |
0.154 |
|
Uric acid,(μmol/L) |
362.2±99.83 |
382.3±137.4 |
0.137 |
|
Cystatin,(mg/L) |
0.99±0.39 |
1.01±0.40 |
0.345 |
|
AST,(U/L) |
36.6 (21.5-146.9) |
78 (23.9-212.0) |
0.324 |
|
TBIL,(μmol/L) |
10.3±5.89 |
11.4±7.36 |
0.104 |
|
Potassium,(mmol/L) |
3.88±0.53 |
3.95±0.62 |
0.186 |
|
Calcium;,(mmol/L) |
2.21±0.20 |
2.18±0.18 |
0.241 |
|
Phosphorus,(mmol/L) |
1.06±0.34 |
1.08±0.32 |
0.386 |
|
Glucose,(mmol/L) |
7.82±4.80 |
9.29±6.76 |
0.025 |
|
CHOL,(mmol/L) |
5.38±1.28 |
5.44±1.51 |
0.383 |
|
Triglyceride,(mmol/L) |
1.95±1.48 |
1.73±1.04 |
0.140 |
|
LDL-C,(mmol/L) |
3.26±1.02 |
3.20±1.07 |
0.331 |
|
NT-proBNP,(pg/ml) |
176 (70.6-504) |
275 (85.7-580) |
0.017 |
|
eGFR(simplified MDRD formula),(ml/min/1.73m²) |
89.8±33.9 |
79.0±24.5 |
0.002 |
CIN:contrast-induced nephropathy; BMI:body mass index;BUN:Blood urea nitrogen; AST:aspartate aminotransferase;TBIL:total bilirubin;CHOL:total cholesterol; LDL-C:low density lipoprotein cholesterin; NT-proBNP:N-terminal pro brain natriuretic peptide; eGFR:glomerular filtration rate; simplified MDRD formula:eGFR=186×(Scr)-1.154×(Age)-0.203×(0.742 If Female).
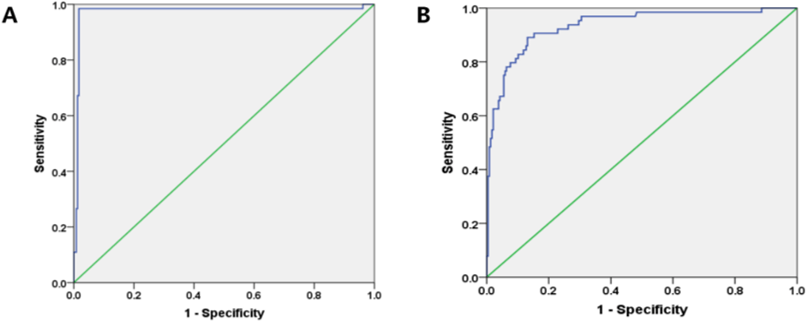
Figure 1: ROC curve of using eGFR to diagnose CIN.
A) The optimum cut-off value for diagnosing CIN was a decrease in eGFR by 22.5% after CAG (sensitivity = 98.4%, specificity = 98.3%, AUC = 0.973, 95%CI: 0.942-1.000, P = 0.000).
B) The optimum cut-off value for diagnosing CIN was a decrease in absolute value of eGFR by 15.6 ml/min/1.73m² after CAG (sensitivity = 89.1%, specificity = 86.9%, AUC = 0.934, 95%CI: 0.898-0.971, P = 0.000).
Table 2: The different prevalence of CIN between patients with Baseline normal Scr or Baseline normal eGFR after CAG.
|
|
Baseline normal Scr(n=271) |
Baseline normal eGFR(n=162) |
|
CIN,n(%) |
56(20.7%) |
25(15.4%) |
|
non-CIN,n(%) |
215(79.3%) |
137(84.6%) |
CIN:contrast-induced nephropathy; eGFR:glomerular filtration rate
Table 3: Risk factors for CIN by logistics regression analysis.
|
|
Univariate analysis |
Multivariate analysis |
||||
|
|
OR |
95% CI |
P |
OR |
95% CI |
P |
|
Male |
0.529 |
0.292-0.958 |
0.036 |
0.411 |
0.188-0.89* |
0.026 |
|
Emergent intervention |
1.853 |
1.017-3.380 |
0.044 |
1.458 |
0.416-5.116 |
0.556 |
|
Multivessel lesion |
1.412 |
0.973-2.049 |
0.129 |
1.269 |
1.024-5.360 |
0.044 |
|
Rehydration therapy |
0.547 |
0.295-1.015 |
0.050 |
1.104 |
0.322-3.781 |
0.875 |
|
Albumin |
0.532 |
0.223-1.323 |
0.179 |
0.549 |
0.199-1.518 |
0.248 |
|
Scr |
1.701 |
1.105-2.793 |
0.016 |
1.106 |
0.647-3.056 |
0.389 |
|
potassium |
1.291 |
0.913-1.824 |
0.183 |
1.406 |
0.639-3.092 |
0.055 |
|
Glucose |
1.367 |
1.026-1.822 |
0.033 |
1.876 |
0.777-4.530 |
0.162 |
|
NT-proBNP |
1.223 |
1.004-1.497 |
0.046 |
1.159 |
0.911-1.475 |
0.230 |
|
eGFR(simplified MDRD formula),(ml/min/1.73m²) |
0.574 |
0.348-0.852 |
0.006 |
0.226 |
0.193-0.558 |
0.002 |
|
Hypertension |
0.487 |
0.849-2.803 |
0.166 |
0.370 |
0.734-2.568 |
0.323 |
|
Diabetes |
2.336 |
1.61-1.835 |
0.048 |
2.640 |
1.098-3.519 |
0.048 |
|
Heart failure |
1.331 |
0.994-1.782 |
0.050 |
1.564 |
1.097-0.770 |
0.608 |
|
Hematocrit; |
0.720 |
0.501-1.036 |
0.076 |
0.793 |
0.510-1.231 |
0.301 |
|
Age |
1.179 |
0.874-1.546 |
0.299 |
-- |
-- |
-- |
|
Stroke |
1.062 |
0.408-2.762 |
0.902 |
|
|
|
|
BMI |
1.186 |
0.682-2.060 |
0.547 |
|
|
|
|
Contrast agent dose |
1.204 |
0.682-2.126 |
0.521 |
|
|
|
|
BUN |
1.312 |
0.695-2.477 |
0.402 |
|
|
|
|
Uric acid |
0.823 |
0.455-1.487 |
0.518 |
|
|
|
|
Cystatin; |
1.116 |
0.882-1.342 |
0.297 |
|
|
|
|
AST |
1.353 |
0.776-2.359 |
0.287 |
|
|
|
|
TBIL |
1.030 |
0.715-4.184 |
0.724 |
|
|
|
|
Calcium |
0.913 |
0.703-1.186 |
0.494 |
|
|
|
|
Phosphorus; |
1.037 |
0.577-1.767 |
0.699 |
|
|
|
|
CHOL |
1.057 |
0.691-1.495 |
0.587 |
|
|
|
|
Triglyceride; |
1.153 |
0.955-1.244 |
0.682 |
|
|
|
|
LDL-C |
0.753 |
0.433-1.309 |
0.315 |
|
|
|
CIN:contrast-induced nephropathy; BMI:body mass index;BUN:blood urea nitrogen; Scr:serum creatinine; AST:aspartate aminotransferase; TBIL:total bilirubin; CHOL:total cholesterol; LDL-C:low density lipoprotein cholesterol ; NT-proBNP:N-terminal pro brain natriuretic peptide; eGFR:estimated glomerular filtration rate; simplified MDRD formula:eGFR=186×(Scr)-1.154×(Age)-0.203×(0.742 Female).
Discussion
I The Value of Scr and eGFR in Evaluating Early Renal Impairment
Early identification of CIN is of great significance to patients, but there are many difficulties. Diagnostic methods based on Scr have proved to be extremely limited. Scr and eGFR are both widely recognized indicators of renal function [16]. But Scr levels can be directly obtained by blood testing, while eGFR needs to be calculated by a complex formula; So eGFR is not as widely used as Scr. Most physicians are accustomed to using Scr to assess the level of renal function in the clinic. However, Scr is not sensitive enough to reflect the early renal dysfunction of the patient, due to the influence of age, sex, activity, weight, race and other factors [17]. Scr is not a perfect marker for reflecting renal function, because reductions of more than 50% in eGFR may occur before any increase in Scr is observed [11]. Therefore, the diagnosis and treatment of renal injury will be delayed. Although it's complicated to calculate eGFR, but because eGFR comprehensive considerate many factors that influence renal function, e.g. gender, age, Scr, race, BUN, ALB, etc., eGFR can much more fully to reflect the real level of renal function.
A study of 3,782 women with hypertension showed that about 50% of patients with a decrease in eGFR were within the normal range of Scr [18]. It is reported that Scr and BUN can still be in normal range in the early stages of renal impairment, when eGFR drops to about 80%. Our study also found that nearly 40% of CHD patients’ Scr was within the normal range, with a decreased eGFR, which is consistent with the literature. Our study also found that patients with the normal eGFR had a lower proportion of CIN than those with normal Scr. If patients with normal Scr are considered with normal renal function before CAG and didn't take any necessary preventive measures, the renal function will be further harm after CAG, thus easy to develop CIN. That why we believe eGFR is a better indicator of early renal impairment than Scr and suggested to use eGFR to evaluate the renal function of CHD patients before and after CAG in order to predict the risk of CIN and cardiovascular events.
II Analysis of the Renal Impairment Related Factors in CHD Patients
With the general development of coronary intervention techniques, the number of CIN is increasing. According to recent studies, the incidence of CIN caused by CAG was as high as 0.6% ~ 2.3% in patients with normal renal function, while the incidence of CIN caused by PCI was 3.3% ~ 14.5%. However, the incidence of CIN in patients with chronic kidney disease, chronic renal insufficiency, advanced age, diabetes, and heart failure is significantly increased, which can be as high as 25% -50% [19-21]. It is reported that the related independent risk factors of CIN are advanced age, application of intra-aortic balloon pump (IABP), renal insufficiency, low hematocrit and diabetes [22-25]. Other scholars believe that the volume of contrast, congestive heart failure, hypotension or low blood volume, hypoalbuminemia and being female are also the risk factors for CIN [26, 27]. A multicenter prospective observational study of 906 patients with cardiac catheterization showed that reduced eGFR is an independent risk factor for CIN after cardiac catheterization [28]. In this study, the incidence of CIN were 21.3%, consistent with the previous report. Logistics regression analysis showed that men, diabetes, multi-vessel coronary artery disease and preoperative levels of eGFR are independent factors of CIN, diabetes and multi-vessel coronary artery disease are risk factors of CIN, while men and high eGFR are protective factors of CIN.
III The Feasibility Study on the Diagnosis of CIN by eGFR Determination and its Optimum Cut-off Value
A study of 860 patients with cardiac catheterization showed that change in eGFR ≤-1.1 mL/min/1.73 m2 was a powerful independent predictor of CIN on the day following cardiac catheterization [16]. Our study found that eGFR was sensitive to early renal impairment in CHD patients. We used the current CIN diagnostic criteria as the gold standard and adopted the simplified MDRD formula to calculate eGFR. ROC curves found that when eGFR decreased 15.6 ml/min/1.73m2, the sensitivity to diagnose CIN was 0.891, with the specificity of 0.869, and the AUC was 0.934. But if we use the relative changes of eGFR to diagnose CIN the optimum cut-off value was eGFR decrease 22.5% after CAG, and the sensitivity is 0.984, with the specificity of 0.983, AUC is 0.973. Thus, maybe using the relative changes of eGFR to diagnose CIN is better than using absolute changes. But there are no relevant criteria of eGFR to the diagnose CIN till now, and the effect of cut-off values on clinical promotion is uncertain. Due to the small number of cases in this study, the optimum cut-off value of eGFR in diagnosis of CIN still needs to be explored and confirmed by further large-scale prospective clinical studies.
Our study has some limitations. First, as a single-centre study with limited sample size, the evidence may not be as strong as that provided by a larger scale, multicenter trial study. The research conclusions only represented the actual situation of the samples in this study. Second, it is a retrospective observational study, and there will inevitably be some bias in the data.
Conclusion
This study demonstrated that eGFR is more sensitive than Scr in reflecting early renal dysfunction. It is an independent factor of CIN development after CAG. The optimum cut-off value of eGFR for diagnosing CIN was found to be a decrease of 22.5%. We should pay more attention to patients with impaired eGFR (< 90 ml/min/1.73m²) before they use contrast media and take precautions to prevent the development of CIN in these patients. Using eGFR to diagnose CIN is feasible in the clinic, but the cut-off value still needs to be confirmed by large scale clinical trials.
Conflicts of Interest
None.
Article Info
Article Type
Research ArticlePublication history
Received: Wed 01, Jan 2020Accepted: Wed 15, Jan 2020
Published: Thu 30, Jan 2020
Copyright
© 2023 Shuxian Zhou . This is an open-access article distributed under the terms of the Creative Commons Attribution License, which permits unrestricted use, distribution, and reproduction in any medium, provided the original author and source are credited. Hosting by Science Repository.DOI: 10.31487/j.JICOA.2020.01.01
Figures & Tables
Table 1: Demographic and clinical characteristics of the study population, according to development of CIN.
|
Male,n(%) |
182(77.1%) |
41(64.1%) |
0.010 |
|
Age, (years) |
63.1±11.2 |
64.8±9.5 |
0.141 |
|
BMI,(Kg/m2) |
24.2±2.9 |
24.4±3.3 |
0.333 |
|
Hypertension,n(%) |
122(51.7%) |
33(51.6%) |
0.110 |
|
Diabetes,n (%) |
29(12.3%) |
15(23.4%) |
0.010 |
|
Stroke,n (%) |
21(8.90%) |
7(10.9%) |
0.160 |
|
Emergent intervention,n (%) |
52(22.0%) |
22(34.4%) |
0.020 |
|
Heart failure,n (%) |
154(65.3%) |
49(76.6%) |
0.030 |
|
Multivessel lesion,n (%) |
183(77.5%) |
55(85.9%) |
0.050 |
|
Hematocrit,n (%) |
41.0±6.5 |
40.2±6.6 |
0.194 |
|
Contrast agent dose, (ml) |
126.8±61.9 |
131.3±60.6 |
0.305 |
|
Rehydration therapy,n (%) |
185(78.4%) |
43(67.2%) |
0.020 |
|
Albumin,(g/L) |
40.3±3.8 |
38.9±4.9 |
0.009 |
|
BUN,(mmol/L) |
5.98±2.69 |
6.04±2.90 |
0.441 |
|
Serum creatinine,(μmol/L) |
87.5±49.4 |
92.4±28.3 |
0.154 |
|
Uric acid,(μmol/L) |
362.2±99.83 |
382.3±137.4 |
0.137 |
|
Cystatin,(mg/L) |
0.99±0.39 |
1.01±0.40 |
0.345 |
|
AST,(U/L) |
36.6 (21.5-146.9) |
78 (23.9-212.0) |
0.324 |
|
TBIL,(μmol/L) |
10.3±5.89 |
11.4±7.36 |
0.104 |
|
Potassium,(mmol/L) |
3.88±0.53 |
3.95±0.62 |
0.186 |
|
Calcium;,(mmol/L) |
2.21±0.20 |
2.18±0.18 |
0.241 |
|
Phosphorus,(mmol/L) |
1.06±0.34 |
1.08±0.32 |
0.386 |
|
Glucose,(mmol/L) |
7.82±4.80 |
9.29±6.76 |
0.025 |
|
CHOL,(mmol/L) |
5.38±1.28 |
5.44±1.51 |
0.383 |
|
Triglyceride,(mmol/L) |
1.95±1.48 |
1.73±1.04 |
0.140 |
|
LDL-C,(mmol/L) |
3.26±1.02 |
3.20±1.07 |
0.331 |
|
NT-proBNP,(pg/ml) |
176 (70.6-504) |
275 (85.7-580) |
0.017 |
|
eGFR(simplified MDRD formula),(ml/min/1.73m²) |
89.8±33.9 |
79.0±24.5 |
0.002 |
CIN:contrast-induced nephropathy; BMI:body mass index;BUN:Blood urea nitrogen; AST:aspartate aminotransferase;TBIL:total bilirubin;CHOL:total cholesterol; LDL-C:low density lipoprotein cholesterin; NT-proBNP:N-terminal pro brain natriuretic peptide; eGFR:glomerular filtration rate; simplified MDRD formula:eGFR=186×(Scr)-1.154×(Age)-0.203×(0.742 If Female).
Table 2: The different prevalence of CIN between patients with Baseline normal Scr or Baseline normal eGFR after CAG.
|
|
Baseline normal Scr(n=271) |
Baseline normal eGFR(n=162) |
|
CIN,n(%) |
56(20.7%) |
25(15.4%) |
|
non-CIN,n(%) |
215(79.3%) |
137(84.6%) |
CIN:contrast-induced nephropathy; eGFR:glomerular filtration rate
Table 3: Risk factors for CIN by logistics regression analysis.
|
|
Univariate analysis |
Multivariate analysis |
||||
|
|
OR |
95% CI |
P |
OR |
95% CI |
P |
|
Male |
0.529 |
0.292-0.958 |
0.036 |
0.411 |
0.188-0.89* |
0.026 |
|
Emergent intervention |
1.853 |
1.017-3.380 |
0.044 |
1.458 |
0.416-5.116 |
0.556 |
|
Multivessel lesion |
1.412 |
0.973-2.049 |
0.129 |
1.269 |
1.024-5.360 |
0.044 |
|
Rehydration therapy |
0.547 |
0.295-1.015 |
0.050 |
1.104 |
0.322-3.781 |
0.875 |
|
Albumin |
0.532 |
0.223-1.323 |
0.179 |
0.549 |
0.199-1.518 |
0.248 |
|
Scr |
1.701 |
1.105-2.793 |
0.016 |
1.106 |
0.647-3.056 |
0.389 |
|
potassium |
1.291 |
0.913-1.824 |
0.183 |
1.406 |
0.639-3.092 |
0.055 |
|
Glucose |
1.367 |
1.026-1.822 |
0.033 |
1.876 |
0.777-4.530 |
0.162 |
|
NT-proBNP |
1.223 |
1.004-1.497 |
0.046 |
1.159 |
0.911-1.475 |
0.230 |
|
eGFR(simplified MDRD formula),(ml/min/1.73m²) |
0.574 |
0.348-0.852 |
0.006 |
0.226 |
0.193-0.558 |
0.002 |
|
Hypertension |
0.487 |
0.849-2.803 |
0.166 |
0.370 |
0.734-2.568 |
0.323 |
|
Diabetes |
2.336 |
1.61-1.835 |
0.048 |
2.640 |
1.098-3.519 |
0.048 |
|
Heart failure |
1.331 |
0.994-1.782 |
0.050 |
1.564 |
1.097-0.770 |
0.608 |
|
Hematocrit; |
0.720 |
0.501-1.036 |
0.076 |
0.793 |
0.510-1.231 |
0.301 |
|
Age |
1.179 |
0.874-1.546 |
0.299 |
-- |
-- |
-- |
|
Stroke |
1.062 |
0.408-2.762 |
0.902 |
|
|
|
|
BMI |
1.186 |
0.682-2.060 |
0.547 |
|
|
|
|
Contrast agent dose |
1.204 |
0.682-2.126 |
0.521 |
|
|
|
|
BUN |
1.312 |
0.695-2.477 |
0.402 |
|
|
|
|
Uric acid |
0.823 |
0.455-1.487 |
0.518 |
|
|
|
|
Cystatin; |
1.116 |
0.882-1.342 |
0.297 |
|
|
|
|
AST |
1.353 |
0.776-2.359 |
0.287 |
|
|
|
|
TBIL |
1.030 |
0.715-4.184 |
0.724 |
|
|
|
|
Calcium |
0.913 |
0.703-1.186 |
0.494 |
|
|
|
|
Phosphorus; |
1.037 |
0.577-1.767 |
0.699 |
|
|
|
|
CHOL |
1.057 |
0.691-1.495 |
0.587 |
|
|
|
|
Triglyceride; |
1.153 |
0.955-1.244 |
0.682 |
|
|
|
|
LDL-C |
0.753 |
0.433-1.309 |
0.315 |
|
|
|
CIN:contrast-induced nephropathy; BMI:body mass index;BUN:blood urea nitrogen; Scr:serum creatinine; AST:aspartate aminotransferase; TBIL:total bilirubin; CHOL:total cholesterol; LDL-C:low density lipoprotein cholesterol ; NT-proBNP:N-terminal pro brain natriuretic peptide; eGFR:estimated glomerular filtration rate; simplified MDRD formula:eGFR=186×(Scr)-1.154×(Age)-0.203×(0.742 Female).
A) The optimum cut-off value for diagnosing CIN was a decrease in eGFR by 22.5% after CAG (sensitivity = 98.4%, specificity = 98.3%, AUC = 0.973, 95%CI: 0.942-1.000, P = 0.000).
B) The optimum cut-off value for diagnosing CIN was a decrease in absolute value of eGFR by 15.6 ml/min/1.73m² after CAG (sensitivity = 89.1%, specificity = 86.9%, AUC = 0.934, 95%CI: 0.898-0.971, P = 0.000).
References
- Dalen JE, Alpert JS, Goldberg RJ, Weinstein RS (2014) The epidemic of the 20(th) century: coronary heart disease. Am J Med 127: 807-812. [Crossref]
- GBD 2017 Causes of Death Collaborators (2018) Global, regional, and national age-sex-specific mortality for 282 causes of death in 195 countries and territories, 1980-2017: a systematic analysis for the Global Burden of Disease Study 2017. Lancet 392: 1736-1788. [Crossref]
- Zhixun Li, Yingtao Zhang, Guangzhong Liu, Haoyang Shao, Weimin Li et al. (2015) Biomed. Signal Process. Control 16: 1-8.
- McCullough PA, Choi JP, Feghali GA, et al. (2016) Contrast-Induced Acute Kidney Injury. J Am Coll Cardiol 68: 1465-1473.
- Chen SQ, Liu Y, Smyth B, Li HL, Sun GL et al. (2018) Clinical Implications of Contrast-Induced Nephropathy in Patients Without Baseline Renal Dysfunction Undergoing Coronary Angiography. Heart Lung Circ 28: 866-873. [Crossref]
- Xu X, Nie S, Liu Z, Chen C, Xu G et al. (2015) Epidemiology and Clinical Correlates of AKI in Chinese Hospitalized Adults. Clin J Am Soc Nephrol 10: 1510-1518. [Crossref]
- Pesarini G, Lunardi M, Ederle F et al. (2016) Long-Term (3 Years) Prognosis of Contrast-Induced Acute Kidney Injury After Coronary Angiography. Am J Cardiol 117: 1741-1746. [Crossref]
- Dhamidharka VR, Kwon C, Stevens G (2002) Serum cystatin C Is Superior to Serum Creatinine as a Marker of Kidney Function: A Meta-Analysis. Am J Kidney Dis 40: 221-226. [Crossref]
- Bolignano D (2012) Serum creatinine and the search for new biomarkers of acute kidney injury (AKI): the story continues. Clin Chem Lab Med 50: 1495-1499. [Crossref]
- Bagshaw SM, Zappitelli M, Chawla LS (2013) Novel biomarkers of AKI: the challenges of progress 'Amid the noise and the haste'. Nephrol Dial Transplant 28: 235-238. [Crossref]
- Waikar SS, Betensky RA, Bonventre JV (2009) Creatinine as the gold standard for kidney injury biomarker studies? Nephrol Dial Transplant 24: 3263-3265. [Crossref]
- Smilde TD, van Veldhuisen DJ, Navis G, Voors AA, Hillege HL (2006) Drawbacks and prognostic value of formulas estimating renal function in patients with chronic heart failure and systolic dysfunction. Circulation 114: 1572-1580. [Crossref]
- Manjunath G, Sarnak MJ, Levey AS (2001) Prediction equations to estimate glomerular filtration rate: an update. Curr Opin Nephrol Hypertens 10: 785-792. [Crossref]
- KDIGO AKI Work Group (2012) KDIGO clinical practice guideline for acute kidney injury. Kidney Int Suppl 2: 1-138.
- Levine GN, Bates ER, Blankenship JC, Bailey SR, Bittl JA et al. (2016) 2015 ACC/AHA/SCAI Focused Update on Primary Percutaneous Coronary Intervention for Patients With ST-Elevation Myocardial Infarction: An Update of the 2011 ACCF/AHA/SCAI Guideline for Percutaneous Coronary Intervention and the 2013 ACCF/AHA Guideline for the Management of ST-Elevation Myocardial Infarction: A report of the American College of Cardiology/American Heart Association Task Force on Clinical Practice Guidelines and the Society for Cardiovascular Angiography and Interventions. Catheter Cardiovasc Interv 87: 1001-1019. [Crossref]
- Watanabe M, Saito Y, Aonuma K, Hirayama A, Tamaki N et al. (2016) CINC-J study investigators. Prediction of contrast-induced nephropathy by the serum creatinine level on the day following cardiac catheterization. J Cardiol 68: 412-418. [Crossref]
- Mujtaba SH, Mahmood SN, Ashraf T, Anjum Q (2012) Glomerular filtration rate rather than serum creatinine should be used for recognizing patients at risk for development of contrast induced nephropathy. Pak J Med Sci 28: 135-138.
- Llisterri Caro JL, Barrios Alonso V, de la Sierra Iserte A et al. (2011) Prevalence of chronic kidney disease in hypertensive women aged 64 years treated in primary care. MERICAP Study. Med Clin (Barc) 138: 512-518. [Crossref]
- Araujo GN, Wainstein MV, McCabe JM, Huang PH, Govindarajulu US et al. (2016) Comparison of Two Risk Models in Predicting the Incidence of Contrast-Induced Nephropathy after Percutaneous Coronary Intervention. J Interv Cardiol 29: 447-453. [Crossref]
- Khatami MR, Nikravan N, Salari-Far M, Davoudi S, Pahlavan-Sabbagh MR (2016) A comparison of definitions of contrast-induced nephropathy in patients with normal serum creatinine. Saudi J Kidney Dis Transpl 27: 94-100. [Crossref]
- Mehran R, Nikolsky E (2006) Contrast-induced nephropathy: definition, epidemiology, and patients at risk. Kidney Int Suppl 100: S11-S15. [Crossref]
- Pan HC, Wu XH, Wan QL, Liu and BH, Wu XS (2018) Analysis of the risk factors for contrast-induced nephropathy in over-aged patients receiving coronary intervention. Exp Biol Med (Maywood) 243: 970-975. [Crossref]
- Ji L, Su X, Qin W, Mi X, Liu F et al. (2015) Novel risk score of contrast-induced nephropathy after percutaneous coronary intervention. Nephrology (Carlton) 20: 544-551. [Crossref]
- Aurelio A, Durante A (2014) Contrast-induced nephropathy in percutaneous coronary interventions: pathogenesis, risk factors, outcome, prevention and treatment. Cardiology 128: 62-72. [Crossref]
- Nikolsky E, Mehran R, Lasic Z, Mintz GS, Lansky AJ et al. (2005) Low hematocrit predicts contrast-induced nephropathy after percutaneous coronary interventions. Kidney Int 67: 706-713. [Crossref]
- Demir OM, Lombardo F, Poletti E, Laricchia A, Beneduce A et al. (2018) Contrast-Induced Nephropathy After Percutaneous Coronary Intervention for Chronic Total Occlusion Versus Non-Occlusive Coronary Artery Disease. Am J Cardiol 122: 1837-1842. [Crossref]
- Xu Q, Wang NN, Duan SB, Liu N, Lei R et al. (2017) Serum cystatin c is not superior to serum creatinine for early diagnosis of contrast-induced nephropathy in patients who underwent angiography. J Clin Lab Anal 31 (5). [Crossref]
- Saito Y, Watanabe M, Aonuma K, Hirayama A, Tamaki N et al. (2015) CINC-J study investigators. Proteinuria and Reduced Estimated Glomerular Filtration Rate Are Independent Risk Factors for Contrast-Induced Nephropathy After Cardiac Catheterization. Circ J 79: 1624-1630. [Crossref]