Combining Bioinformatics and Experiments to Identify and Verify Gene Prognostic Markers in Hepatocellular Carcinoma
A B S T R A C T
Background: Hepatocellular Carcinoma (HCC) is one of the highly malignant tumors threatening human health. The current research aimed to identify potential prognostic gene biomarkers for HCC.
Materials and Methods: Microarray data of gene expression profiles of HCC from GEO were downloaded. After screening overlapping differentially expressed genes (DEGs) by R software. The STRING database and Cytoscape were used to identify hub genes. Cox proportional hazards regression was performed to screen the potential prognostic genes. Moreover, quantitative real-time PCR analyses were performed to detect the expression of ANLN in liver cancer cells and tissues. Finally, its possible pathways and functions were predicted using gene set enrichment analysis (GSEA).
Result: A total of 566 DEGs were obtained from the overlapping analysis of three mRNA microarray dataset. Six key hub genes including RACGAP1, KIF20, DLGAP5, CDK1, BUB1B and ANLN, were associated with poor prognosis of patients with HCC. Higher expression of ANLN was associated with reduced overall survival and disease-free survival in patients with HCC. Multivariate analysis revealed that ANLN expression was an independent risk factor affecting overall survival. RT-PCR and Western blot analysis further demonstrated that ANLN expression was increased in HCC compared with patient-matched adjacent normal tissues. Notably, Gene enrichment analysis revealed that DEGs in ANLN-high patients were enriched in cell cycle, DNA duplication and p53 signaling pathway.
Conclusion: The high expression of RACGAP1, KIF20, DLGAP5, CDK1, BUB1B and ANLN might be poor prognostic biomarkers in HCC patients, and may help to individualize the management of HCC.
Keywords
Hepatocellular carcinoma, prognosis, biomarkers, database, RT-PCR
Introduction
Hepatocellular carcinoma (HCC) is the most common type of primary liver cancer, representing about 90% of all cases of primary liver cancer cases, and is the third leading cause of cancer-related death worldwide [1]. An epidemiological survey revealed that, 4 million new HCC cases were diagnosed in 2015, and it keeps on a continuous increasing trend [2]. HCC has a poor prognosis and high mortality rate worldwide; even neo-adjuvant chemotherapy, wide surgical resection and adjuvant chemotherapy were adopted, the incidence of local recurrence and distant metastasis still remains at a high level [3]. Recently, various molecular targeting drugs such as imatinib, sorafenib, sunitinib, and pazopanib have appeared through developing biotechnology, which has prolonged the HCC patient survival, however, the average life expectancy remains less than one year [4-8]. The pathogenesis of HCC is extremely complicated and remains unclear. The role of the tumor microenvironment in cancer progression has been increasingly verified in recent studies, with a sequence of biological events have been established as an effective biomarker predicting HCC prognosis [9]. It might be possible to discover some novel and practical therapeutic targets for HCC by integrating various molecules in gene networks associated with tumorigenesis and tumor progression.
Recently, microarray technology and bioinformatic analysis have been used extensively for detecting gene expression levels, particularly in seeking differentially expressed genes (DEGs) related to the carcinogenesis and progression of tumors [10]. The Gene Expression Omnibus (GEO) database enables mass accurate and comprehensive information of gene expression on diseases to acquire. GEO database mining mainly include screening differentially expressed genes, molecular signaling and correlation, and gene regulation networks. The Cancer Genome Atlas (TCGA) comprises multiple comprehensive cancer genomic datasets on tumor staging, metastasis, survival, patient age, gender and corresponding clinical numbers for researchers, which is a database of the most large-scale sequencing results. Oncomine is currently the world’s largest cancer microarray database and web-based data-mining platform, with 715 gene expression databases and more than 86,000 samples of cancer and normal tissues collected so far.
In this study, we downloaded large-scale gene datasets of HCC from GEO, Oncomine and TCGA databases. After integrated analysis of these databases, we identified six gene constituent markers from the common DEGs, that is RACGAP1, KIF20, DLGAP5, CDK1, BUB1B and ANLN. Kaplan–Meier plotter analysis showed that RACGAP1, KIF20, DLGAP5, CDK1, BUB1B and ANLN had high diagnostic values for patients with HCC. Then, we conducted a gene signature of ANLN for prognosis of HCC patients by univariate and multivariable Cox regression analyses, Reverse Transcription-polymerase Chain Reaction (RT-PCR) analysis were performed to detect the expression of ANLN in 4 liver cancer cell lines and 12 HCC patient samples from The Affiliated Hospital of Southwest Medical University. Our work aims to provide evidence for RACGAP1, KIF20, DLGAP5, CDK1, BUB1B and ANLN acting as prognostic biomarkers, thus, potentially reveal a new target and strategy for HCC treatment.
Materials and Methods
I Data Collection and Identification of DEGs
Series matrix files of GSE19655, GSE84402 and GSE29721 were downloaded from the GEO database (Link 1). The datasets of GSE19655 and GSE29721 comprised 10 paired normal and tumor samples. The datasets of GSE84402 included 14 pairs of tumor and matched adjacent normal tissues. The limma package in R programme was applied to screen the DEGs between normal liver tissue and HCC samples. The adjusted P‑value <0.05 and |logFC| >1 was considered statistically significant. We used FunRich (Link 2) to obtain the overlapping DEGs among GSE19655, GSE29721 and GSE84402.
II Gene Ontology (GO) Terms and Kyoto Encyclopedia of Genes and Genomes (KEGG) Pathway Enrichment Analysis
The Database for Annotation, Visualization and Integrated Discovery (DAVID, Link 3) provides a comprehensive set of functional annotation tools for researchers to identify the biological meaning behind abundant genes. GO, including molecular function, biological processes (BP) and cellular components and KEGG pathway enrichment analyses were performed for identified DEGs using the DAVID database (version 6.7). FDR <0.05 was considered to be statistically significant.
III PPI Network and Hub Genes Identified
The online tool Search Tool for the Retrieval of Interacting Genes (STRING, Link 4) was used for visualizing the interactive relationships of the overlapping DEGs. We used the Cytoscape software (Link 5) to figure out a protein-protein interacts (PPI) network of common DEGs. PPI network of DEGs was constructed by The MCODE app. Cox proportional hazards regression was performed to filtrate the potential key prognostic genes.
IV Oncomine and TCGA Database Analysis
The RNA sequencing datasets of HCC tissues and adjacent normal tissues including clinicopathological information were downloaded from Oncomine database (Link 6). Raw counts of gene expression and corresponding clinical information of HCC patients were obtained from the TCGA data portal (Link 7). To assess gene expression between ANLN -high and -low patients, expression profile data were ranked from low to high quartiles according to the ANLN expression, and data in the bottom 25% and top 25% were selected as low and high groups. R package edgeR (version 3.4.1) was used to analysis the differential gene expression between ANLN-high and -low patients. An adjusted P value <0.05 and |logFC| >1 was considered to be statistically significant.
V Gene Set Enrichment Analysis
We carried out Gene Ontology (GO) terms and pathway enrichment analysis of predicted target genes by using Metascape database (Link 8). Thereafter, Gene set enrichment analysis (GSEA) were performed on the aberrant expression genes between ANLN high- and low-expression patients. Gene clusters with adjusted P<0.05 and FDR <0.05 were considered to be significantly enriched genes.
VI Patients and Samples
This study was approved by the ethics committee of The Affiliated Hospital of Southwest Medical University. A total of 12 cases of HCC and 12 cases of adjacent tissue specimens were collected from The Affiliated Hospital of Southwest Medical University in this study. Patients with a previous history of other primary tumors or those who had received chemotherapy and/or radiotherapy were excluded from this study. The pathologist analysed the tumor samples and made a definitive diagnosis. Freshly dissected human liver tissue samples from surgical excision were snap-frozen in liquid nitrogen and stored at -80°C until use.
VII Cell Culture
Hepatocellular carcinoma cell lines (Hep3B, SMMC-7721, LM3 and Huh7) and L02 were purchased from the American Type Culture Collection (ATCC, Manassas, VA), and cultured in complete culture medium (HyClone, Logan, UT, USA) supplemented with 10% fetal bovine serum (FBS; Gibco, Grand Island, NY, USA), 100 U/ml penicillin (Gibco), and 100 μg/ml streptomycin (Gibco) at 37°C and 5% CO2. Before harvest, all cells were seeded in a 6-pore plate at a density of 1×10⁶ cells in the culture medium. 24 hours later, the cells were washed with PBS and extracted by using 1 milliliters Trizol reagent (Invitrogen, Carlsbad, CA, USA) per well. All data from cell lines were repeated in 3 independent experiments, each in triplicate.
VIII RNA Extraction and Reverse Transcription-Polymerase Chain Reaction
RNA extraction from liver tissues (20 mg) and cultured cells was performed using Trizol reagent (Invitrogen, Carlsbad, CA, USA) [11]. The concentration and purity of the isolated RNA were evaluated using a Nanodrop spectrophotometer and reverse transcribed to cDNA using the PrimeScript™ RT Reagent kit (Takara) following the manufacturer’s protocol. Then, 5 ng cDNA was amplified in a 15 μl total volume and performed with a Bio-Rad C1000 thermal cycler CFX96 Real-Time System. The cycling programme was composed of an initial step to activate the enzyme at 95°C for 3 min, followed by 40 cycles of 95°C for 10 sec, 60°C for 20 sec and 72°C for 1 sec. The primers were as follows: ANLN forward, 5‘- TGCCAGGCGAGAGAAT CTTC-3’ and reverse, 5‘- CGCTTAGCATGAGTCATAGACCT-3’. GAPDH forward, 5‘-ACAACTTTGGTATCGTGGAAGG-3’ and reverse, 5‘-GCCATCACGCCACAGT TTC-3’. Relative expression of ANLN was determined after normalization to GAPDH. Data are expressed as the relative quantification of target mRNA, which was calculated based on the equation: fold change = 2-Δ(Δ Ct), where △Ct = Cttarget gene- CtGAPDH, and △ (△Ct) = △Ctstimulated-△Ctcontrol.
IX Western Blotting Analysis
Protein of HCC tissue samples were extracted by using in RIPA buffer with protease/phosphatase inhibitors (Roche) as described [12]. Then, a BCA kit (Thermo Fisher Scientific, MA, USA) was used to detect protein concentration. Equal amounts of proteins from tissue were loaded on 10% sodium dodecyl sulphatepolyacrylamide gels (SDS-PAGE) at 110 volts. Thereafter, proteins were transferred to a PVDF membrane (Millipore, Bedford, MA) for 2 hours at 250 milliampere. After blocking for 1 hour with 5% non-fat milk in PBS-Tween-20 solution at room temperature, the membranes were incubated the primary antibodies ANLN (A6524, ABclonal, Wuhan, China, 1:2000) and GAPDH (A19056, ABclonal, Wuhan, China, 1:2000) overnight at 4°C. After washing 5 times with PBS-Tween-20 solution, the membranes were incubated with another 1 h with conjugated secondary antibodies (Zen-bioscience, 1:10000). The signals were detected by using enhanced chemiluminescence (Millipore). Finally, after being extensively washed with PBS-Tween-20 solution buffer, the membrane was incubated with horseradish peroxidase-substrate (Millipore, Billerica, MA, USA) and the signal was acquired by a LAS-4000 Luminescent Image Analyser.
X Statistical Analysis
Data were expressed as the median with individual data and analysed in GraphPad Prism 7.0.4 (RRID:SCR_002798, GraphPad Software Inc., San Diego, CA, USA). The statistical analysis of the two groups was performed using a paired two-tailed Student’s t-test. Fold change to control was used in the analysis of mRNA expressions to avoid the larger variation among different experiments. R package ‘ggplot2’ was used to draw the different scatter plot, forest plot, volcano plot, venn plot and heatmap. A Cox regression model was used to estimate the hazard ratio (HR) and 95% confidence interval (Cl) associated with ANLN expression. p<0.05 was considered to be statistically significant.
Result
I Identification and Analysis of DEGs in HCC
After standardization of the microarray results, DEGs (1326 in GSE84402, 2056 in GSE19665 and 4231 in GSE29721) were identified. As shown in the Venn diagram (Figure 1A), the overlap among the 3 datasets included 566 DEGs (139 downregulated genes and 427 upregulated genes) between liver cancer and normal tissues. Figure 1B showed top 60 significantly differential genes in the DEGs, including top 30 upregulated genes and 30 downregulated genes (Figure 1B). We next analysed the biological classification of DEGs. GO and KEGG pathway analysis results revealed that the upregulated DEGs were significantly enriched in cell division, mitotic nuclear division, cell cycle and DNA replication (Figure 1C). Meanwhile, changes in downregulated DEGs were significantly enriched in oxidoreductase activity, heme binding and organelle membrane. KEGG pathway analysis revealed that the downregulated DEGs were mainly enriched in retinol and drug metabolism and chemical carcinogenesis (Figure 1D).

Figure 1: Identification of the DEGs. A) Identification of the DEGs between HCC and normal liver tissues in three datasets via a Venn diagram. B) Top 30 upregulated DEGs and 30 downregulated DEGs in patients with HCC. C) GO and KEGG Enrichment Analysis among the upregulated DEGs in patients with HCC. D) GO and KEGG Enrichment Analysis among the downregulated DEGs in patients with HCC.
DEGs: differentially expressed genes; GO: Gene Ontology; KEGG: Kyoto Encyclopedia of Genes and Genomes.
II Identification and Analysis of Hub Genes in HCC
To determine the functions of these genes, a PPI network among the DEGs was constructed by using STRING online tool (Figure 2A). Then, by using the MCODE app from Cytoscape, a total of 34 hub genes of the DEGs were identified (Figure 2B). By performing cox proportional hazards regression, 6 genes including cyclin-dependent kinase 1 (CDK1), Rac GTPase-activating protein 1 (RACGAP1), kinesin family member 20A (KIF20A), DLG associated protein 5 (DLGAP5), BUB1 mitotic checkpoint serine/threonine kinase B (BUB1B) and ANLN were identified as key genes related to HCC prognosis. Oncomine datasets analysis further confirmed these genes were upregulated in HCC patients compared with that in the cirrhosis, liver cell dysplasia and normal liver samples (Figure 2C). Consistently, K-M survival curves in (Figures 3A & 3B) show that the higher expression level of RACGAP1, KIF20, DLGAP5, CDK1, BUB1B and ANLN was significantly correlated with poor survival and disease-free survival (Figures 3A & 3B).

Figure 2: Identification of hub genes from the DEGs by STRING and MCODE. A) A PPI network was constructed. B) The hub genes with a degree cut-off ¼ 2, haircut on, node score cut-off ¼ 0.2, k-core ¼ 2, and max. depth ¼ 100 were screened with MCODE. C) Relative expression of RACGAP1, KIF20, DLGAP5, CDK1, BUB1B and ANLN in HCC.
**compared with HCC, p<0.01
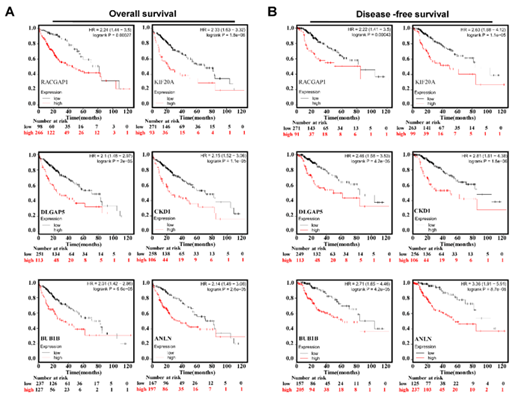
Figure 3: Analysis of RACGAP1, KIF20, DLGAP5, CDK1, BUB1B and ANLN in TCGA database. A) Overall survival of HCC patients with higher expression of RACGAP1, KIF20, DLGAP5, CDK1, BUB1B and ANLN. B) Disease-free survival of HCC patients with higher expression of RACGAP1, KIF20, DLGAP5, CDK1, BUB1B and ANLN.
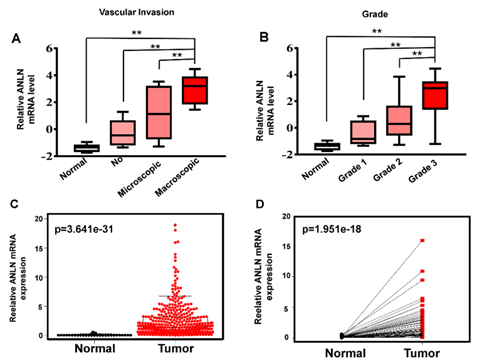
Figure 4: Analysis of ANLN in Oncomine and TCGA database. A) Relative ANLN expression in HCC with or without vascular invasion by using oncomine database. B) Relative ANLN expression in HCC with different grade by using oncomine database. C) The relative mRNA expression of ANLN in the TCGA database. D) The relative level of ANLN expression is higher in HCC than patient-matched adjacent normal tissues.
** compared with normal liver, p<0.01.
III ANLN Expression is Upregulated in HCC Based on TCGA Datasets
To investigate the clinical relevance of biomarker in HCC, we filtered out ANLN and analysed its expression in sub-group with different clinic pathological features. Invasion of malignant cells to endothelium is a major part of metastasis. In this study, we then assessed the relation vascular invasion and the expression of ANLN, and the results suggest that ANLN is upregulated in angiogenesis and metastases of liver cancer (Figure 4A). Moreover, with the increase of histological grade of HCC, the expression of ANLN increased (Figure 4B).
Next, we retained cases of clinical parameters and survival data in the TCGA hepatocellular carcinoma dataset. There were a total of 407 tumor tissue samples and 58 normal liver tissues. The expression of the ANLN gene and clinical parameters in dataset was extracted by using R package. In the TCGA database, the gene expression of ANLN was found to be significantly upregulated in HCC tissues (Figure 4C). Meanwhile, paired t-test showed ANLN expression was increased in HCC tissues compared with matched adjacent normal tissues (Figure 4D). We then used X-tile software to find the optimal cut-off point to parse patients into subsets with different survival outcomes based on ANLN expression and stratified 407 HCC patients into ANLN-high (n = 181) and -low (n = 226) subgroups [13]. The expression level of mRNA marker, TMN stage, disease stages, tumor grade, age and gender were incorporated in the Cox regression model. Univariate analysis and multivariate analysis found that high expression of ANLN may serve as a potential independent prognostic factor for liver cancer patients (Figure 5 & Table 1).
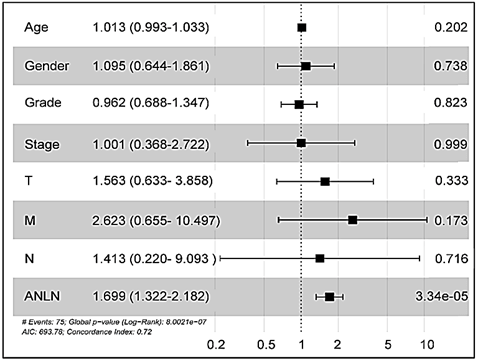
Figure 5: Cox regression model analysis of overall survival in hepatocellular carcinoma. Cox regression model was established to analyse the independent factors including TMN stage, disease stages, tumor grade, age and gender on the survival prognosis.
Table 1: Cox regression model analysis of overall survival in hepatocellular carcinoma.
|
Variables |
Univariate analysis |
p-value |
Multivariate analysis |
p-value |
||
|
HR |
95%Cl of HR |
HR |
95%Cl of HR |
|||
|
Age (<60 vs ≥60) (years) |
1.005 |
0.987-1.023 |
0.591 |
1.013 |
0.201 |
|
|
Gender (Male vs Female) |
0.780 |
0.487-1.249 |
0.301 |
1.094 |
0.644-1.861 |
0.738 |
|
Grade (G1+G2 vs G3+G4) |
1.017 |
0.746-1.387 |
0.914 |
1.962 |
0.687-1.347 |
0.823 |
|
Stage (I-II vs III-IV) |
1.865 |
1.456-2.388 |
8.07e-07*** |
1.001 |
0.368-3.722 |
0.999 |
|
T1+T2 vs T3+T4 |
1.804 |
1.434-2.270 |
4.73e-07*** |
1.562 |
0.633-3.858 |
|
|
M1 vs M0 |
3.850 |
1.207-12.281 |
0.023* |
2.622 |
0.655-10.497 |
0.173 |
|
N0 + N1 vs N2 + N3 |
2.022 |
0.494-8.276 |
0.328 |
1.413 |
0.218-9.092 |
0.716 |
|
1.135 |
1.082-1.200 |
1.41e-07*** |
1.698 |
1.322-2.181 |
||
Note: *p <0.05; ***p<0.001.
IV Gene Expression Levels of ANLN in Human Liver Cancer Cells and Tissues
To further validate the expression of ANLN in human liver cancer cells and tissues, we performed RT-PCR analysis. Our data showed that ANLN mRNA in liver cancer cell lines (SMMC-7721, Hep3B, Huh7 and LM3) were higher than that in L02 (normal liver cell line) (Figure 6A). Then, the expression of ANLN was evaluated in 12 HCC samples and matched adjacent normal tissues (n = 12) (Figure 6B). Meanwhile, we utilized The Human Protein Atlas (Link 9) database to explore the protein expression of the ANLN gene in HCC tissues and normal liver tissues. As shown in (Figure 6C), the positive degree of ANLN increases with the malignant degree of HCC (Figure 6C). Furthermore, we performed western blotting analysis to detect the ANLN protein levels in tissues, and consistently, the protein levels of ANLN was upregulated significantly in HCC (Figure 6D).
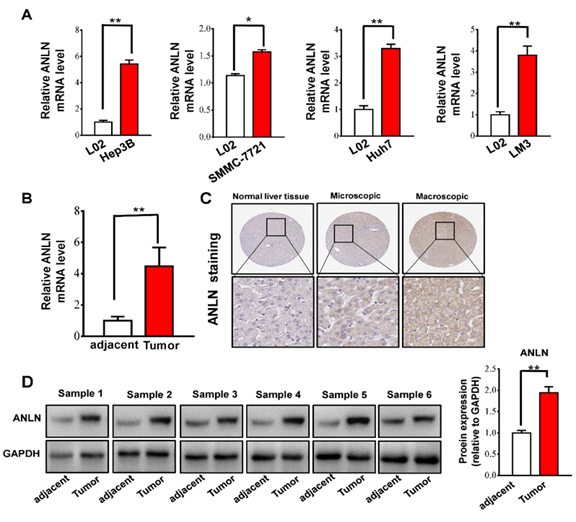
Figure 6: ANLN gene expression was increased in different liver cancer cells and tissue. A) RT-PCR analysis of ANLN expression levels in liver cancer cell lines of SMMC-7721, Hep3B, Huh7, LM3 and normal liver cell lines (n = 3 experiments). B) RT-PCR analysis of ANLN expression levels in HCC and adjacent normal tissues (n = 12). C) Representative immunohistochemistry staining of ANLN in HCC and patient-matched adjacent normal tissues. D) Western blot analysis of ANLN protein levels in HCC and adjacent normal tissues (n = 6). Data represent the mean ± SD.
*p<0.05. **p<0.01. ***p<0.001.
V Potential Mechanism of ANLN in Regulating the Progression of HCC
We performed a RNAseq gene expression analysis to elucidate whether ANLN could play a role in promoting HCC occurrence. By comparing the gene expression profiles of ANLN-high and -low groups, we found a total of 477 upregulated genes (>2-fold) and 580 downregulated genes (>2-fold) were detected in ANLN-high group (Figure 7A). GO analysis revealed changes in gene sets were related to cell cycle and DNA replication in patients with higher expression of ANLN (Figures 7B & 7C). GSEA analysis was next used to obtain further insight into the biologic pathways linked to HCC pathogenesis according to ANLN expression level. Gene signatures of cell cycle, DNA duplication and p53 signaling pathway were enriched in ANLN-high patients as revealed in enrichment plots of GSEA (Figure 7D). Thus, the expression of these genes is strongly correlated with the up-regulation of ANLN.

Figure 7: Identifying differentially expressed genes between ANLN -high and -low patients. A) Volcano plot of differential gene profiles between ANLN-high and -low groups. red plots represent upregulated genes, and green plots represent downregulated genes. B) Top 20 functional path enrichment analysis heatmap enriched in ANLN-high patients. C) Network showing functional and pathway correlations. Different colours in the map represent different functional groups. D) GSEA analysis shows that genes involved in cell cycle, DNA duplication and p53 signaling pathway are enriched in ANLN-high patients.
Discussion
HCC is reported as the most common form of primary liver cancer and has a high incidence worldwide. Its mortality is rapidly increasing in the United States and Europe [14]. HCC is characterized by high malignancy, insidious onset, high invasive capacity, and rapid infiltrative growth, thus attracted increasing attention in recent years [15]. Hepatocarcinogenesis is a complex biological process consisting of multi-gene interaction or abnormal activation of cellular signaling pathways such as Wnt/β-catenin, hedgehog, and ERK signaling pathways [16]. Study of disease-associated biomarkers may help to understand, diagnose, prognosticate and treat patients more efficiently. From basic chemotherapy to molecular-targeted therapy such as EGFR, ALK, VEGFR, and the immunotherapy represented by PD-1/PD-L1 monoclonal antibody, the treatment of HCC has entered a personalized precision treatment era [13, 17-19]. With the rapid development of molecular biology, a large number of proteomics and genomics studies have confirmed that the biological behaviours such as malignant degree, invasion and metastasis of HCC are related to the differential expression of mRNA [20]. These studies are of great significance for finding biomarkers and help to individualize the management of HCC.
In this study, we downloaded and used the HCC dataset from GEO database to analyse the sequencing data of liver tissue and its paracancerous tissues. With FC > 2 as the threshold, a total of 566 differentially expressed genes were screened. Furthermore, we found that the upregulated genes were significantly enriched in biological pathways such as mitosis and chromosome segregation, mainly involved in cell cycle pathways. Through the analysis of protein-protein interaction network, 30 hub genes including UBE2C, RRM2, RACGQP1 located in the central node were obtained. Moreover, the transcriptional level of RACGAP1, KIF20A, DLGAP5, CDK1, BUB1B and ANLN in HCC was significantly increased, and the expression of these key genes were negatively correlated with overall survival rate and disease-free survival rate.
RACGAP1 (RacGTPase-activating protein 1) is a Rac GTPase-activating protein that participated in cellular growth, transformation and metastasis. High RACGAP1 levels were associated with poor DFS of patients with breast cancer [21]. RacGAP1 transcriptional level in patients with colorectal cancer (CRC) was elevated, and increased with higher vessel invasion, T stage, lymph node and distant metastasis [22]. KIF20A, also known as RAB6KIFL/MKlp2, is a motor kinesin protein. It is reported that KIF20A promoted pancreatic cancer invasiveness by transporting IGF2BP3 (RNA-binding protein) in cell protrusions. Knockdown of KIF20A decreased the IGF2BP3-containing stress granules accumulation [23]. Another analysis also demonstrated that KIF20A was highly expressed in gliomas, and patients with higher KIF20A levels lead to poorer prognosis [24]. DLGAP5 (DLG associated protein 5) has an essential role in spindle assembly process. Downregulation of DLGAP5 promoted a reduction in the invasion and migration of CRC. By contrast, overexpression of this gene leads to poor prognosis in distinct subtypes [25]. Cyclin-dependent kinase (CDK) belongs to serine / threonine protein family. CDK1 is indispensable in the human cell cycle and has been considered as an effective clinical prognostic marker in non-small cell lung cancer, liver cancer and breast cancer [26-29].
The mitotic checkpoint serine/threonine kinase B (BUB1B) belongs to SAC protein family [30]. Abnormal expression of BUB1B gene will lead to spindle failure, defective cells will continue to divide and maintain chromosome instability, produce characteristic aberration chromosomes, and eventually lead to malignant transformation of cells. It has been reported that BUB1B is overexpressed in many kinds of tumor tissues, such as renal cell carcinoma, breast cancer, gastric cancer and so on [31-34]. Anillin protein encoded by ANLN gene is an actin-binding protein [35]. Anillin protein plays an important role in mitosis. In recent years, it has been found that abnormal expression of ANLN leads to tumorigenesis and development, and its expression level is closely related to tumor invasiveness [36]. It has been found that ANLN gene is highly expressed in breast cancer, colon cancer, liver cancer, lung cancer and other types of malignant tumors, and is closely related to the invasion and progression of tumors [37, 38]. Therefore, the abnormal proliferation of RACGAP1, KIF20A, DLGAP5, CDK1, BUB1B, ANLN in hepatocellular carcinoma is closely related to poor prognosis and can be used as a prognostic marker of hepatocellular carcinoma.
We are further studying the TCGA database downloading the HCC data set for in-depth study of ANLN. The results showed that the expression of ANLN in HCC was significantly increased, which was closely related to the degree of grading. In order to further confirm the results of TCGA chip screening, we first detected the transcription level of ANLN in Hep3B, SMMC-7721, Huh7, LM3 cell lines, and found that there was a significant difference in ANLN transcription level between the control group and the experimental group. Then qRT-PCR and Western blot analysis was carried out in hepatocellular carcinoma and adjacent liver samples, and it was confirmed that the expression of ANLN was significantly high in HCC tissues. In addition, after significant correlation between sex, age, TNM stage and N stage, ANLN was an independent prognostic factor. GSEA analysis further confirmed that the differential genes were mainly enriched in the cell cycle, DNA duplication and p53 signaling pathway clusters.
Conclusion
The high expression of RACGAP1, KIF20, DLGAP5, CDK1, BUB1B and ANLN might be poor prognostic biomarkers in HCC patients, and may help to individualize the management of HCC.
Acknowledgement
We sincerely thank the researchers for providing their TCGA, Oncomine and The Human Protein Atlas databases information online. It is our pleasure to acknowledge their contributions.
Author Contributions
L.Z., L.L. and R.W. designed this research, analysed both experimental and genomics data and wrote the manuscript; Y.L. provided the funding. P.Z., D.T. and X.L performed the RT-PCR experiment; W.Z. and X.T. performed data collection and pre-processing of data.
Funding
This study was supported by research funding from the Science and Technology Planning Project of Sichuan Province (2019YFS0180 to Y.L.), Science and Technology Program of Luzhou (2015-LZCYD-S02 to Y.L.).
Availability of Data and Materials
All data generated or analysed in this study are included in this published article.
Ethical Approval
All of the patient samples used in this study were stored by the biobank of our hospital. HCC samples being used for this research was approved by the ethics committee of The Affiliated Hospital of Southwest Medical University (Luzhou city, Sichuan Province, China) before we start the experiment.
Consent for Publication
Not applicable.
Conflicts of Interest
None.
Article Info
Article Type
Research ArticlePublication history
Received: Fri 12, Mar 2021Accepted: Thu 18, Mar 2021
Published: Thu 25, Mar 2021
Copyright
© 2023 Li Luo. This is an open-access article distributed under the terms of the Creative Commons Attribution License, which permits unrestricted use, distribution, and reproduction in any medium, provided the original author and source are credited. Hosting by Science Repository.DOI: 10.31487/j.COR.2021.04.02
Figures & Tables
Table 1: Cox regression model analysis of overall survival in hepatocellular carcinoma.
|
Variables |
Univariate analysis |
p-value |
Multivariate analysis |
p-value |
||
|
HR |
95%Cl of HR |
HR |
95%Cl of HR |
|||
|
Age (<60 vs ≥60) (years) |
1.005 |
0.987-1.023 |
0.591 |
1.013 |
0.201 |
|
|
Gender (Male vs Female) |
0.780 |
0.487-1.249 |
0.301 |
1.094 |
0.644-1.861 |
0.738 |
|
Grade (G1+G2 vs G3+G4) |
1.017 |
0.746-1.387 |
0.914 |
1.962 |
0.687-1.347 |
0.823 |
|
Stage (I-II vs III-IV) |
1.865 |
1.456-2.388 |
8.07e-07*** |
1.001 |
0.368-3.722 |
0.999 |
|
T1+T2 vs T3+T4 |
1.804 |
1.434-2.270 |
4.73e-07*** |
1.562 |
0.633-3.858 |
|
|
M1 vs M0 |
3.850 |
1.207-12.281 |
0.023* |
2.622 |
0.655-10.497 |
0.173 |
|
N0 + N1 vs N2 + N3 |
2.022 |
0.494-8.276 |
0.328 |
1.413 |
0.218-9.092 |
0.716 |
|
1.135 |
1.082-1.200 |
1.41e-07*** |
1.698 |
1.322-2.181 |
||
Note: *p <0.05; ***p<0.001.
DEGs: differentially expressed genes; GO: Gene Ontology; KEGG: Kyoto Encyclopedia of Genes and Genomes.
**compared with HCC, p<0.01
** compared with normal liver, p<0.01.
*p<0.05. **p<0.01. ***p<0.001.
References
1. Desai A, Sandhu S, Lai JP, Sandhu DS (2019) Hepatocellular carcinoma in non-cirrhotic liver: A comprehensive review. World J Hepatol 11: 1-18. [Crossref]
2. Chen W, Zheng R, Baade PD, Zhang S, Zeng H et al. (2016) Cancer statistics in China, 2015. CA Cancer J Clin 66: 115-132. [Crossref]
3. Mokdad AA, Singal AG, Yopp AC (2016) Advances in Local and Systemic Therapies for Hepatocellular Cancer. Curr Oncol Rep 18: 9. [Crossref]
4. Lin AY, Fisher GA, So S, Tang C, Levitt L (2008) Phase II study of imatinib in unresectable hepatocellular carcinoma. Am J Clin Oncol 31: 84-88. [Crossref]
5. Pinyol R, Montal R, Bassaganyas L, Sia D, Takayama T et al. (2019) Molecular predictors of prevention of recurrence in HCC with sorafenib as adjuvant treatment and prognostic factors in the phase 3 STORM trial. Gut 68: 1065-1075. [Crossref]
6. Pokuri VK, Tomaszewski GM, Ait Oudhia S, Groman A, Khushalani NI et al. (2018) Efficacy, Safety, and Potential Biomarkers of Sunitinib and Transarterial Chemoembolization (TACE) Combination in Advanced Hepatocellular Carcinoma (HCC): Phase II Trial. Am J Clin Oncol 41: 332-338. [Crossref]
7. Yau T, Chen PJ, Chan P, Curtis CM, Murphy PS et al. (2011) Phase I dose-finding study of pazopanib in hepatocellular carcinoma: evaluation of early efficacy, pharmacokinetics, and pharmacodynamics. Clin Cancer Res 17: 6914-6923. [Crossref]
8. Cucchetti A, Trevisani F, Bucci L, Ravaioli M, F Farinati F et al. (2016) Years of life that could be saved from prevention of hepatocellular carcinoma. Aliment Pharmacol Ther 43: 814-824. [Crossref]
9. Tsuchiya N, Sawada Y, Endo I, Saito K, Uemura Y et al. (2015) Biomarkers for the early diagnosis of hepatocellular carcinoma. World J Gastroenterol 21: 10573-10583. [Crossref]
10. Hung JH, Weng Z (2017) Analysis of Microarray and RNA-seq Expression Profiling Data. Cold Spring Harb Protoc 2017. [Crossref]
11. Pu S, Ren L, Liu Q, Kuang J, Shen J et al. (2016) Loss of 5-lipoxygenase activity protects mice against paracetamol-induced liver toxicity. Br J Pharmacol 173: 66-76. [Crossref]
12. Yao L, Cui X, Chen Q, Yang X, Fang F et al. (2017) Cold-Inducible SIRT6 Regulates Thermogenesis of Brown and Beige Fat. Cell Rep 20: 641-654. [Crossref]
13. Feng Z, Rong P, Wang W (2019) Meta-analysis of the efficacy and safety of PD-1/PD-L1 inhibitors administered alone or in combination with anti-VEGF agents in advanced hepatocellular carcinoma. Gut 69: 1904-1906. [Crossref]
14. Singal AG, Lampertico P, Nahon P (2020) Epidemiology and surveillance for hepatocellular carcinoma: New trends. J Hepatol 72: 250-261. [Crossref]
15. Zhou J, Sun HC, Wang Z, Cong WM, Wang JH et al. (2018) Guidelines for Diagnosis and Treatment of Primary Liver Cancer in China (2017 Edition). Liver Cancer 7: 235-260. [Crossref]
16. Chen C, Wang G (2015) Mechanisms of hepatocellular carcinoma and challenges and opportunities for molecular targeted therapy. World J Hepatol 7: 1964-1970. [Crossref]
17. Wu Z, Galmiche A, Liu J, Stadler N, Wendum D et al. (2017) Neurotensin regulation induces overexpression and activation of EGFR in HCC and restores response to erlotinib and sorafenib. Cancer Lett 388: 73-84. [Crossref]
18. Zhao D, Zhai B, He C, Tan G, Jiang X et al. (2014) Upregulation of HIF-2alpha induced by sorafenib contributes to the resistance by activating the TGF-alpha/EGFR pathway in hepatocellular carcinoma cells. Cell Signal 26: 1030-1039. [Crossref]
19. Ma LJ, Feng FL, Dong LQ, Zhang Z, Duan M et al. (2018) Clinical significance of PD-1/PD-Ls gene amplification and overexpression in patients with hepatocellular carcinoma. Theranostics 8: 5690-5702. [Crossref]
20. Dhanasekaran R, Nault JC, Roberts LR, Zucman-Rossi J (2019) Genomic Medicine and Implications for Hepatocellular Carcinoma Prevention and Therapy. Gastroenterology 156: 492-509. [Crossref]
21. Pliarchopoulou K, Kalogeras KT, Kronenwett R, Wirtz RM, Eleftheraki AG et al. (2013) Prognostic significance of RACGAP1 mRNA expression in high-risk early breast cancer: a study in primary tumors of breast cancer patients participating in a randomized Hellenic Cooperative Oncology Group trial. Cancer Chemother Pharmacol 71: 245-255. [Crossref]
22. Imaoka H, Toiyama Y, Saigusa S, Kawamura M, Kawamoto A et al. (2015) RacGAP1 expression, increasing tumor malignant potential, as a predictive biomarker for lymph node metastasis and poor prognosis in colorectal cancer. Carcinogenesis 36: 346-354. [Crossref]
23. Taniuchi K, Furihata M, Saibara T (2014) KIF20A-mediated RNA granule transport system promotes the invasiveness of pancreatic cancer cells. Neoplasia 16: 1082-1093. [Crossref]
24. Saito K, Ohta S, Kawakami Y, Yoshida K, Toda M (2017) Functional analysis of KIF20A, a potential immunotherapeutic target for glioma. J Neurooncol 132: 63-74. [Crossref]
25. Branchi V, Garcia SA, Radhakrishnan P, Győrffy B, Hissa B et al. (2019) Prognostic value of DLGAP5 in colorectal cancer. Int J Colorectal Dis 34: 1455-1465. [Crossref]
26. Santamaria D, Barriere C, Cerqueira A, Hunt S, Tardy C et al. (2007) Cdk1 is sufficient to drive the mammalian cell cycle. Nature 448: 811-815. [Crossref]
27. Kim SJ, Nakayama S, Miyoshi Y, Taguchi T, Tamaki Y et al. (2008) Determination of the specific activity of CDK1 and CDK2 as a novel prognostic indicator for early breast cancer. Ann Oncol 19: 68-72. [Crossref]
28. Shi Q, Zhou Z, Ye N, Chen Q, Zheng X et al. (2017) MiR-181a inhibits non-small cell lung cancer cell proliferation by targeting CDK1. Cancer Biomark 20: 539-546. [Crossref]
29. Zhou Z, Li Y, Hao H, Wang Y, Zhou Z et al. (2019) Screening Hub Genes as Prognostic Biomarkers of Hepatocellular Carcinoma by Bioinformatics Analysis. Cell Transplant 28: 76S-86S. [Crossref]
30. Scintu M, Vitale R, Prencipe M, Gallo AP, Bonghi L et al. (2007) Genomic instability and increased expression of BUB1B and MAD2L1 genes in ductal breast carcinoma. Cancer Lett 254: 298-307. [Crossref]
31. Xue JM, Liu Y, Wan LH, Zhu YX (2020) Comprehensive Analysis of Differential Gene Expression to Identify Common Gene Signatures in Multiple Cancers. Med Sci Monit 26: e919953. [Crossref]
32. Wei W, Lv Y, Gan Z, Zhang Y, Han X et al. (2019) Identification of key genes involved in the metastasis of clear cell renal cell carcinoma. Oncol Lett 17: 4321-4328. [Crossref]
33. Zhou W, Wang Z, Shen N, Pi W, Jiang W et al. (2015) Knockdown of ANLN by lentivirus inhibits cell growth and migration in human breast cancer. Mol Cell Biochem 398: 11-19. [Crossref]
34. Dun B, Sharma A, Xu H, Liu H, Bai S et al. (2013) Transcriptomic changes induced by mycophenolic acid in gastric cancer cells. Am J Transl Res 6: 28-42. [Crossref]
35. Field CM, Alberts BM (1995) Anillin, a contractile ring protein that cycles from the nucleus to the cell cortex. J Cell Biol 131:165-178. [Crossref]
36. Magnusson K, Gremel G, Rydén L, Pontén V, Uhlén M et al. (2016) ANLN is a prognostic biomarker independent of Ki-67 and essential for cell cycle progression in primary breast cancer. BMC Cancer 16: 904. [Crossref]
37. Wang G, Shen W, Cui L, Chen W, Hu X et al. (2016) Overexpression of Anillin (ANLN) is correlated with colorectal cancer progression and poor prognosis. Cancer Biomark 16: 459-465. [Crossref]
38. Long X, Zhou W, Wang Y, Liu S (2018) Prognostic significance of ANLN in lung adenocarcinoma. Oncol Lett 16: 1835-1840. [Crossref]